graphics_dislin_test
graphics_dislin_test,
a C++ code which
illustrate how various kinds of data can be displayed and analyzed
graphically using the dislin() graphics library.
Some common plot types include:
-
animation, a sequential display of images which are meant
to suggest motion or evolution.
-
bar, a display of values y(1:n) in which every value
y(i) is represented by a bar of that height.
-
bar3d, a display of values z(1:m,1:n) over a 2D grid,
in which every value z(i,j) is represented by a bar of that height.
-
barh, a display of values x(1:n) in which every value
x(i) is represented by a horizontal bar of that length.
The horizontal format can be more suitable for labeling bars
when there are many of them.
-
between, a line plot of a curve, and a filled plot of
the area between the curve and the x-axis. Alternatively,
a filled plot of the area between two curves.
-
binary_tree, a connected directed graph with no circuits,
in which each node has no more than 2 descendants.
-
contour fill, a display of values z(x,y) in which the values of
z are suggested by regions filled with color.
-
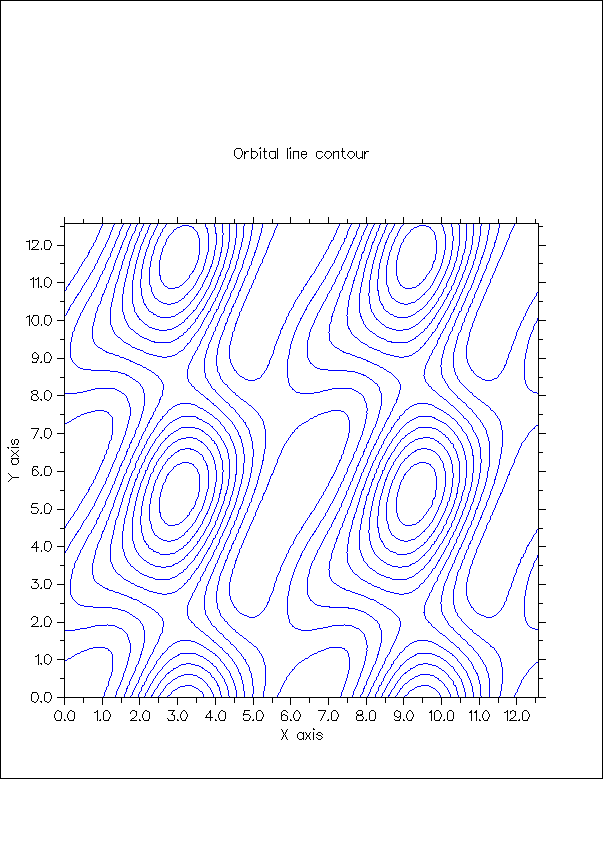
contour line, a display of values z(x,y) in which the values of
z are suggested by colored contour lines.
-
decision_tree, a connected directed graph with no circuits,
in which labeled nodes represent current states to be tested, and edges
represent the choice or decision to move from one state to another.
-
dendrogram, a connected directed graph with no circuits,
which generally has a single root node, and illustrates the
genealogy or relatedness of a set of objects.
-
digraph, a "directed graph", nodes (possibly with defined
locations, labels or colors), connected by directed edges
(possibly with defined weights, labels, colors or linestyles).
-
fill, a shape composed of polygons, each of which is
filled with a particular color.
-
graph, nodes (possibly with defined locations, labels or
colors), connected by undirected edges (possibly with defined weights,
labels, colors or linestyles).
-
histogram, a display of values x in which the x range
is divided into intervals, and the value y(i) represents the
number of x values in the i-th interval, and a bar plot of
intervals versus count is displayed.
-
plot, a display of a single curve defined by a sequence of
functional pairs (x,y(x)), or a function y=f(x) sampled over an
interval, or a sequence of related pairs (x,y).
-
plot3d, a 3D display of a single curve defined by a sequence of
triples (x(i),y(i),z(i)), or a parametric function (x(t),y(t),z(t))
sampled over an interval.
-
plots, several curves on a single display.
-
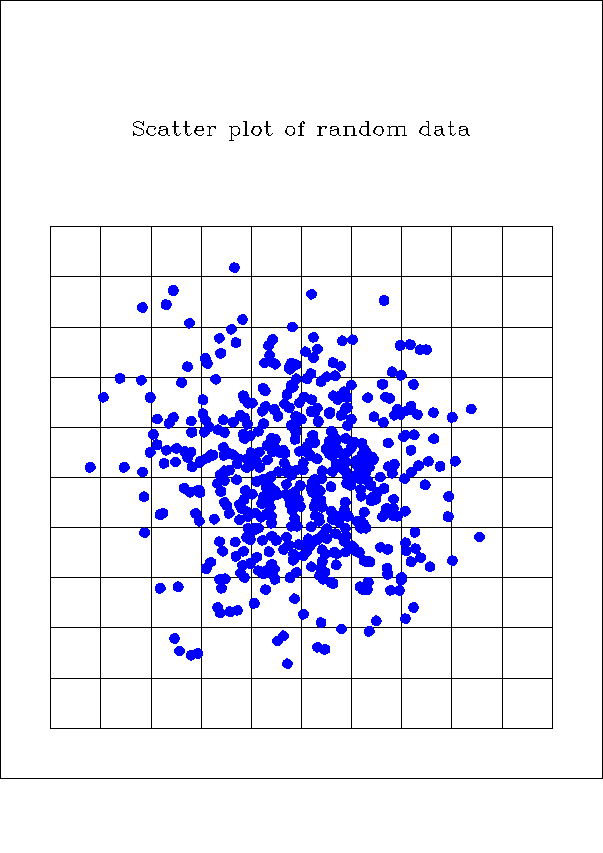
scatter, a display of unconnected pairs (x,y), whose
positions are indicated by markers.
-
scatter3d, a 3D display of unconnected triples (x,y,z), whose
positions are indicated by markers.
-
scatters, a scatter plot involving several distinct sets of
(x,y) pairs are displayed, distinguished by markers of different
size, shape or color.
-
subplots, a display involving two or more separate plots,
shown as a single figure.
-
surface, a 3D display of values z(x,y), represented
as a surface.
-
vector, a 2D display of vectors (u,v)(x,y), representing
a gradient field, an ODE direction field, or a flow of some kind.
Licensing:
The information on this web page is distributed under the MIT license.
Languages:
graphics_dislin_test is available in
a C/dislin() version and
a C/gnuplot() version and
a C++/dislin() version and
a C++/gnuplot() version and
a Fortran90/dislin() version and
a Fortran90/gnuplot() version and
a MATLAB version and
an Octave version and
a Python version and
an R version.
Related Data and Programs:
dislin_test,
C++ codes which
use dislin(), which
is a scientific graphics package,
by Helmut Michels.
gnuplot_test,
C++ codes which
write data and command files
so that the gnuplot() program can create plots of the results.
Reference:
-
Helmut Michels,
The Data Plotting Software DISLIN - version 10.4,
Shaker Media GmbH, January 2010,
ISBN13: 978-3-86858-517-9.
Source code:
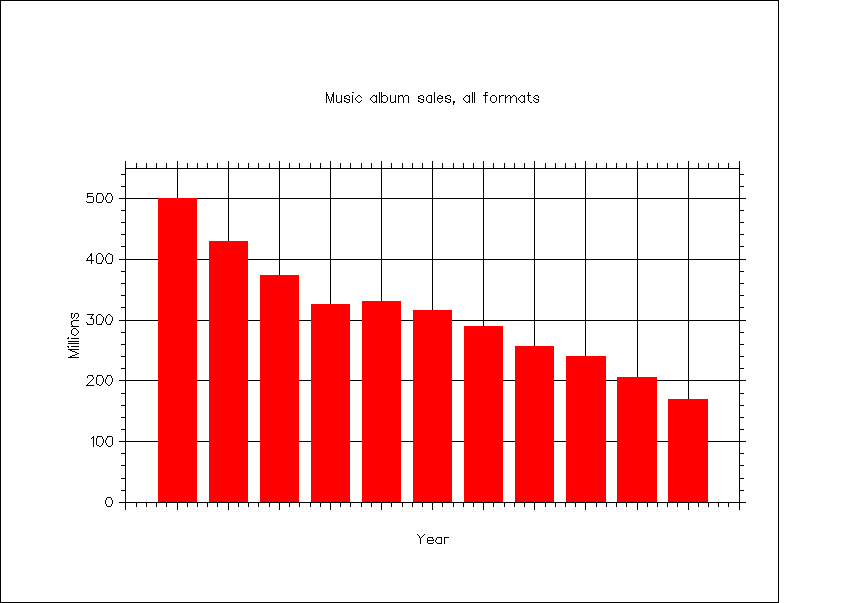
album_bar lists the year, and total number of music albums
(LP's, cassettes, CD's and dowloads) sold each year from 2007 to 2017.
This data is plotted as a bar graph.
The dislin() library is used.
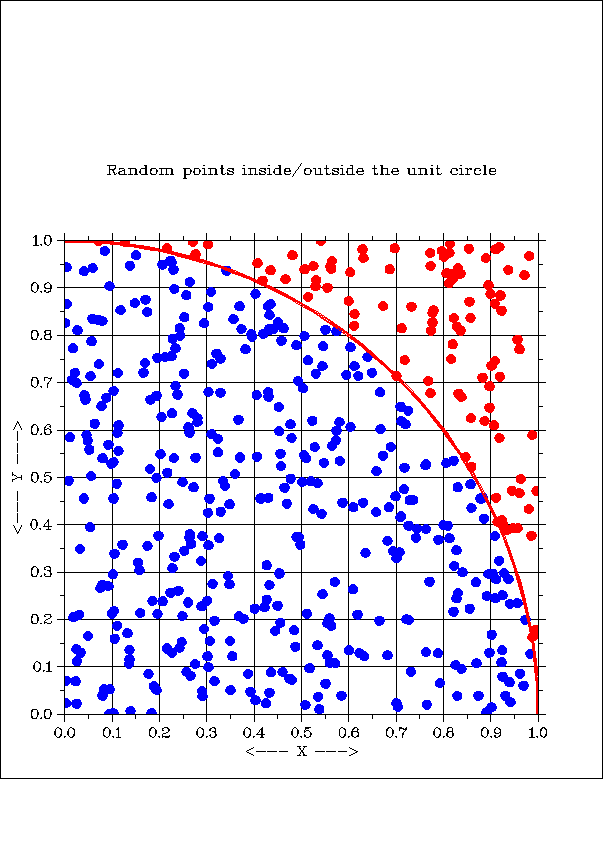
circle_scatters depicts 500 pairs of (X,Y) data points in the unit square,
395 of which lie inside the unit circle, and 105 outside. If possible,
the "inside" points should be blue, the "outside" points red, and the
circle itself should also be drawn.
The dislin library is used.
geyser_bar works with measurements of the waiting time in
minutes between successive eruptions of the Old Faithful geyser. The
data has been grouped into bins. The bin counts are displayed as a bar
chart.
The dislin library is used.
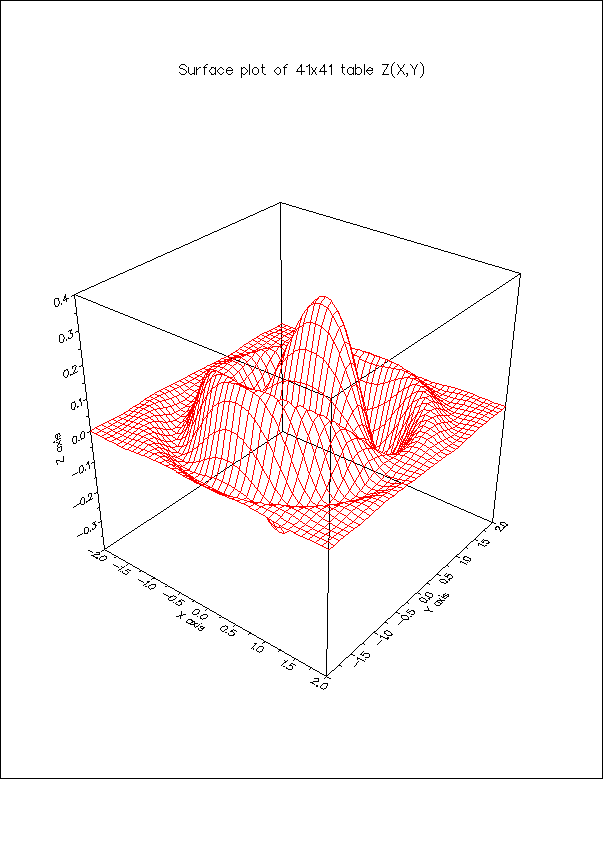
grid_surface records, on a 41x41 grid over [-2,2]x[-2,+2], the values
z = exp(-(x^2+y^2)) * cos(0.25*x) * sin(y) * cos(2*(x^2+y^2)).
The data is to be plotted as a surface.
The dislin library is used.
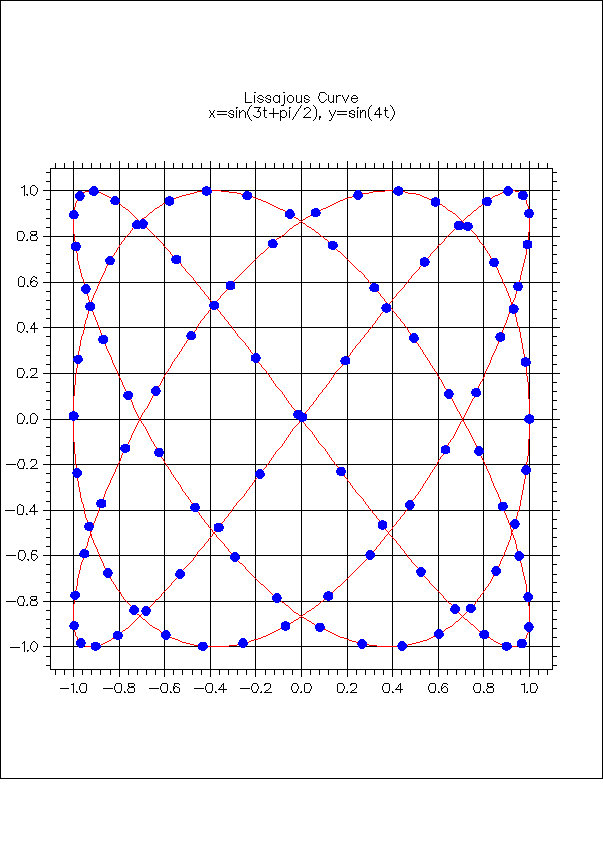
lissajous_plot records 1000 points on a Lissajous curve defined by
x=sin(3*t+pi/2), y=sin(4t). The curve is to be plotted and every tenth
point marked.
The dislin library is used.
lynx_plot records the yearly lynx harvest from 1821 to 1934.
The graph should plot the data points as circles, and connect consecutive
data points with straight line segments to suggest a curve.
The dislin library is used.
orbital_line_contour records, on a 101x101 grid over [0,4*pi]x[0,4*pi],
the minimum distance between two planets given a pair of orbital angles.
The data is presented as a line contour plot.
The dislin library is used.
random_scatter generates 500 pairs of (X,Y) data, which lie in
the unit square, and tend to cluster around (0.5,0.5).
The dislin library is used.
Last modified on 20 August 2020.