graphics_gnuplot_test
graphics_gnuplot_test,
a C++ code which
illustrates how various kinds of data can be displayed and analyzed
graphically, using the gnuplot() graphics program.
Some common plot types include:
-
animation, a sequential display of images which are meant
to suggest motion or evolution.
-
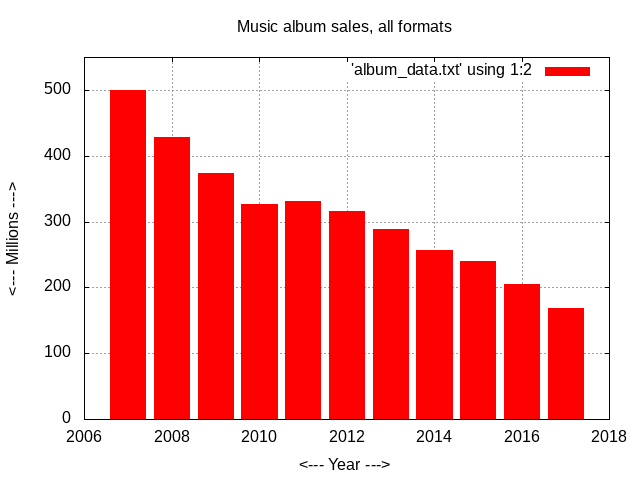
bar, a display of values y(1:n) in which every value
y(i) is represented by a bar of that height.
-
bar3d, a display of values z(1:m,1:n) over a 2D grid,
in which every value z(i,j) is represented by a bar of that height.
-
barh, a display of values x(1:n) in which every value
x(i) is represented by a horizontal bar of that length.
The horizontal format can be more suitable for labeling bars
when there are many of them.
-
binary_tree, a connected directed graph with no circuits,
in which each node has no more than 2 descendants.
-
contour fill, a display of values z(x,y) in which the values of
z are suggested by regions filled with color.
-
contour line, a display of values z(x,y) in which the values of
z are suggested by colored contour lines.
-
decision_tree, a connected directed graph with no circuits,
in which labeled nodes represent current states to be tested, and edges
represent the choice or decision to move from one state to another.
-
dendrogram, a connected directed graph with no circuits,
which generally has a single root node, and illustrates the
genealogy or relatedness of a set of objects.
-
digraph, a "directed graph", nodes (possibly with defined
locations, labels or colors), connected by directed edges
(possibly with defined weights, labels, colors or linestyles).
-
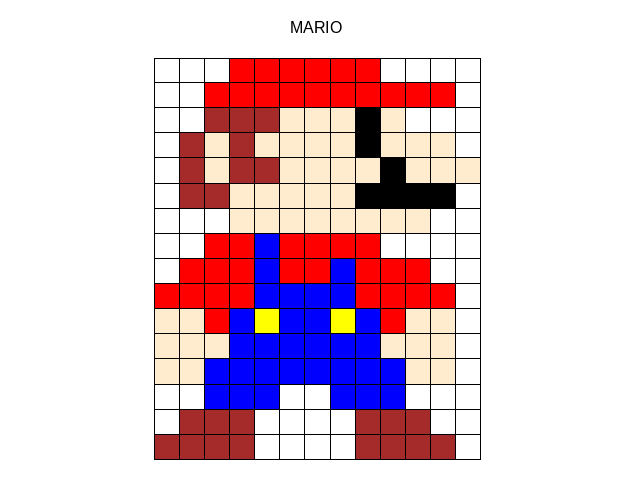
fill, a shape composed of polygons, each of which is
filled with a particular color.
-
graph, nodes (possibly with defined locations, labels or
colors), connected by undirected edges (possibly with defined weights,
labels, colors or linestyles).
-
histogram, a display of values x in which the x range
is divided into intervals, and the value y(i) represents the
number of x values in the i-th interval, and a bar plot of
intervals versus count is displayed.
-
plot, a display of a single curve defined by a sequence of
functional pairs (x,y(x)), or a function y=f(x) sampled over an
interval, or a sequence of related pairs (x,y).
-
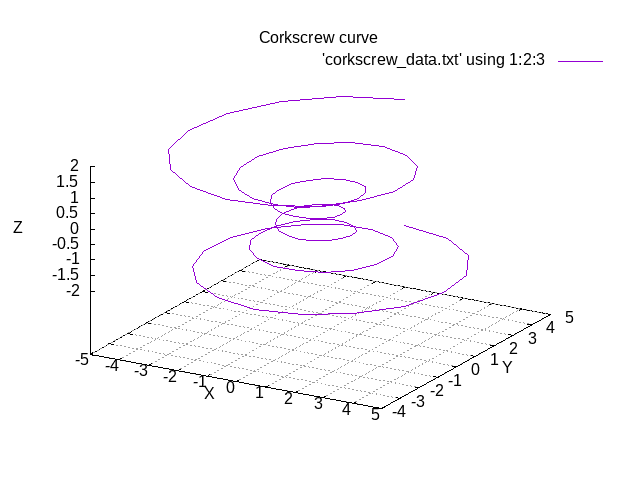
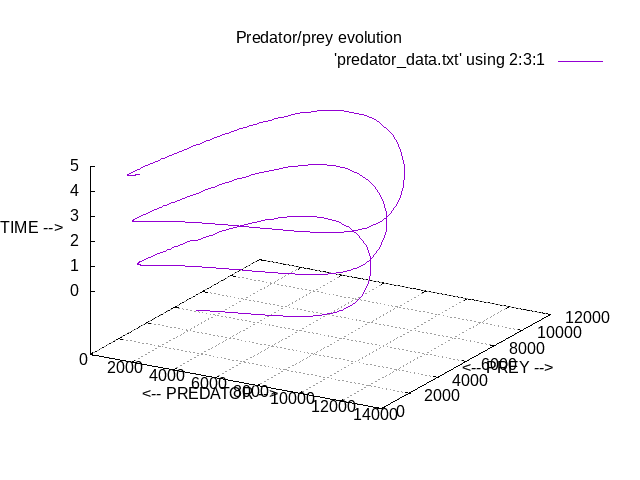
plot3d, a 3D display of a single curve defined by a sequence of
triples (x(i),y(i),z(i)), or a parametric function (x(t),y(t),z(t))
sampled over an interval.
-
plots, several curves on a single display.
-
scatter, a display of unconnected pairs (x,y), whose
positions are indicated by markers.
-
scatter3d, a 3D display of unconnected triples (x,y,z), whose
positions are indicated by markers.
-
scatters, a scatter plot involving several distinct sets of
(x,y) pairs are displayed, distinguished by markers of different
size, shape or color.
-
subplots, a display involving two or more separate plots,
shown as a single figure.
-
surface, a 3D display of values z(x,y), represented
as a surface.
-
vector, a 2D display of vectors (u,v)(x,y), representing
a gradient field, an ODE direction field, or a flow of some kind.
Licensing:
The computer code and data files described and made available on this web page
are distributed under
the MIT license
Languages:
graphics_gnuplot_test is available in
a C/dislin() version and
a C/gnuplot() version and
a C++/dislin() version and
a C++/gnuplot() version and
a FORTRAN90/dislin() version and
a FORTRAN90/gnuplot() version and
a MATLAB version and
an Octave version and
a Python version and
an R version.
Related Data and Programs:
dislin_test,
C++ codes which
use dislin(), which
is a scientific graphics package,
by Helmut Michels.
gnuplot_test,
C++ codes which
write data and command files
so that the gnuplot() program can create plots of the results.
Reference:
-
Philipp Janert,
Gnuplot in Action: Understanding Data with Graphs,
Manning, 2010,
ISBN13: 978-1-933988-39-8,
LC: QA276.4.J37.
-
Helmut Michels,
The Data Plotting Software DISLIN - version 10.4,
Shaker Media GmbH, January 2010,
ISBN13: 978-3-86858-517-9.
Source code:
album_bar lists the year, and total number of music albums
(LP's, cassettes, CD's and dowloads) sold each year from 2007 to 2017.
This data is plotted as a bar graph.
The gnuplot() program is used.
corkscrew_plot3d generates (X,Y,Z) points that lie along a 3D curve
looking something like a corkscrew.
The gnuplot() program is used.
mario_fill makes a simple image of Mario,
by constructing a grid of squares filled with color.
The gnuplot() program is used.
predator_plot3d models the populations of predators (foxes) and prey
(rabbits) over time. A 3D plot of (time, rabbits, foxes) is created.
The gnuplot() program is used.
Last modified on 28 July 2020.