xy_display, a Python code which reads a set of 2D points from a simple XY graphics file and plots them.
xy_display ( 'filename.xy' )where
The information on this web page is distributed under the MIT license.
xy_display is available in a MATLAB version and a Python version.
xy, a data directory of examples of XY files, a simple 2D graphics point format;
xyz_display, a Python code which reads a set of 3D points from a file and plots them.
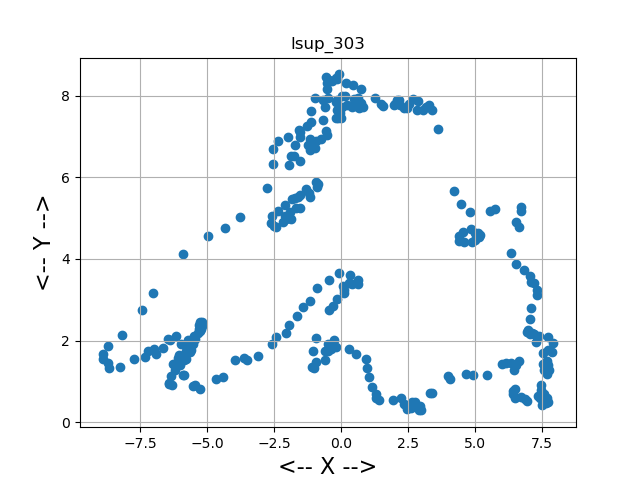
LSUP_303_2D is a set of 303 points that outline Lake Superior: