pwc_plot_1d, a Python code which plots piecewise constant (PWC) data.
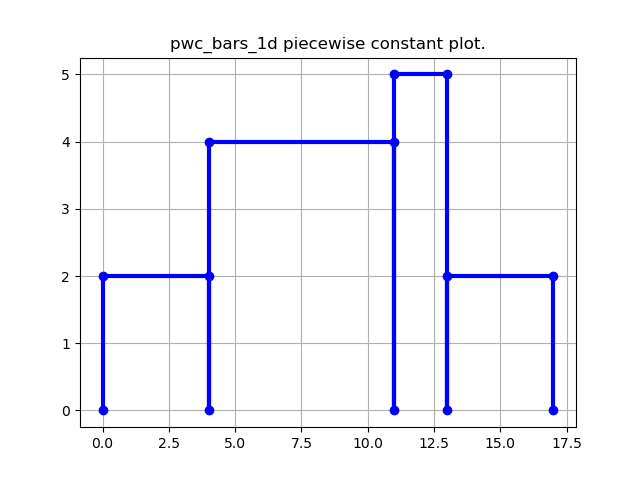
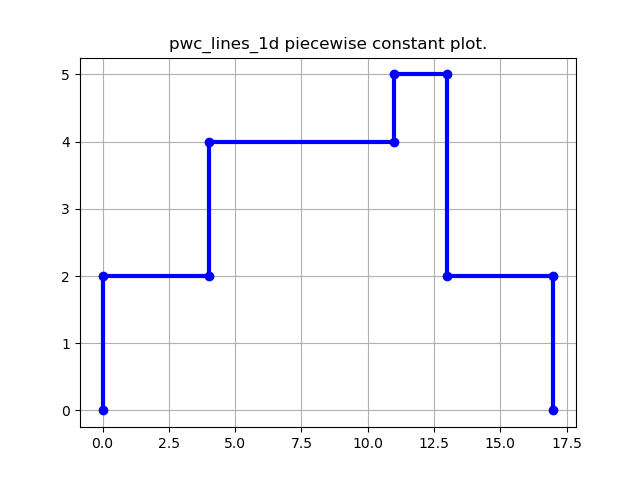
Suppose you want to plot a piecewise constant function as N bars of varying heights and widths, or as a sequence of step functions. This is NOT quite a bar plot or histogram, and it's not the line graph created by connecting the data points.
The pwc_plot_1d() library assumes that your function is defined as N+1 breakpoints X and N values Y. That is, between X(I) and X(I+1), your function has the value Y(I), for I from 1 to N. The bar plot or line plot should exactly correspond to this idea.
To create the correct bar plot or line graph, the library converts your X and Y data into vectors XP and YP of length 2*N+2 or 3*N+1 which, if simply given to the plot() command, will display the corresponding piecewise constant function.
The information on this web page is distributed under the MIT license.
pwc_plot_1d is available in a MATLAB version and an Octave version and a Python version.