epicycloid, a Python code which plots an epicycloid curve.
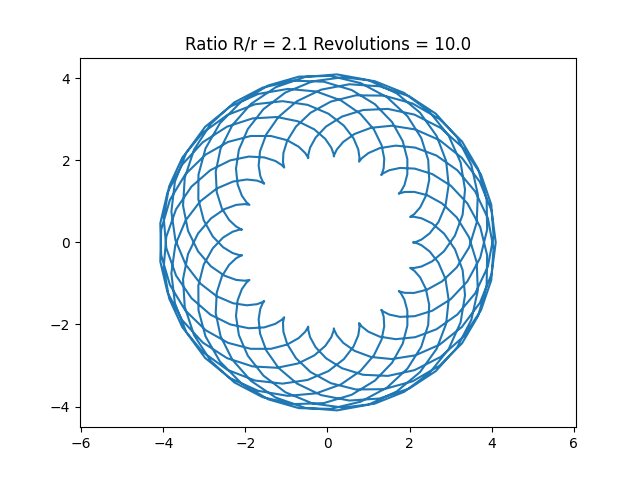
An epicycloid is the curve traced by a point on the perimeter of a circle of radius r1 which is rolling around the perimeter of a a circle of radius r2. Normally, r1 is smaller than r2.
The equations for the (x,y) coordinates of the point are:
        x(t) = (r1+r2) * cos(t) - r1 * cos ( (r1+r2)*t/r1 )
        y(t) = (r1+r2) * sin(t) - r1 * sin ( (r1+r2)*t/r2 )
It is usual to write k = r2/r1. If k is an integer, then the curve
is closed, and has k cusps. If k is rational, and in lowest terms
is p/q, then it has p cusps. Otherwise, if k is irrational, then
mathematically the curve is not closed, and fills the annulus
of radiuses r2 and r2+r1.
To use the programs, you specify:
The information on this web page is distributed under the MIT license.
epicycloid is available in a MATLAB version and an Octave version and a Python version.
python_plots, a Python code which uses plotting to illustrate a mathematical structure, such as an iterative map, a fractal, a curve or surface.