CVTP is a dataset directory which contains examples of CVTP's, that is, Centroidal Voronoi Tessellations defined on a periodic domain, usually a rectangle or hyperrectangle.
Each dataset contains N points in M-dimensions, with the points having the property that they are (approximately) the centroids of the Voronoi regions that they generate within one cell of a periodically repeating region.
The computer code and data files described and made available on this web page are distributed under the GNU LGPL license.
TABLE, a file format which is used to store the data.
PLOT_POINTS, a FORTRAN90 program which was used to make images of some of the 2D datasets.
TABLE_TOP, a FORTRAN90 program which was used to make pairwise coordinate plots of some of the higher dimensional datasets
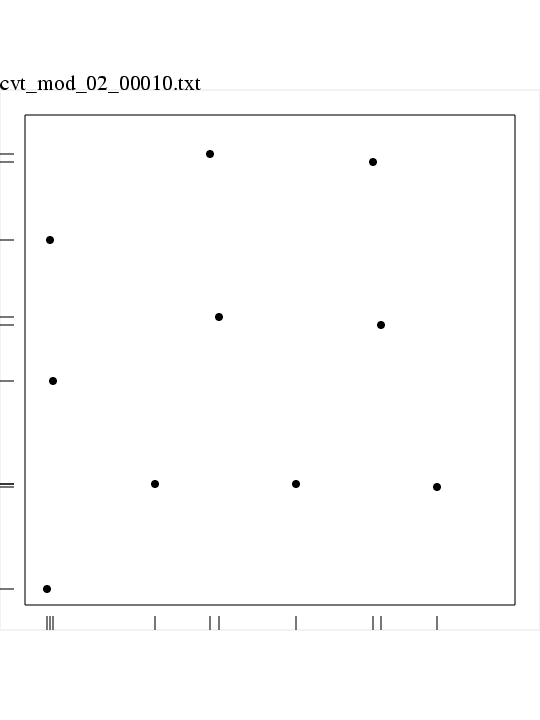
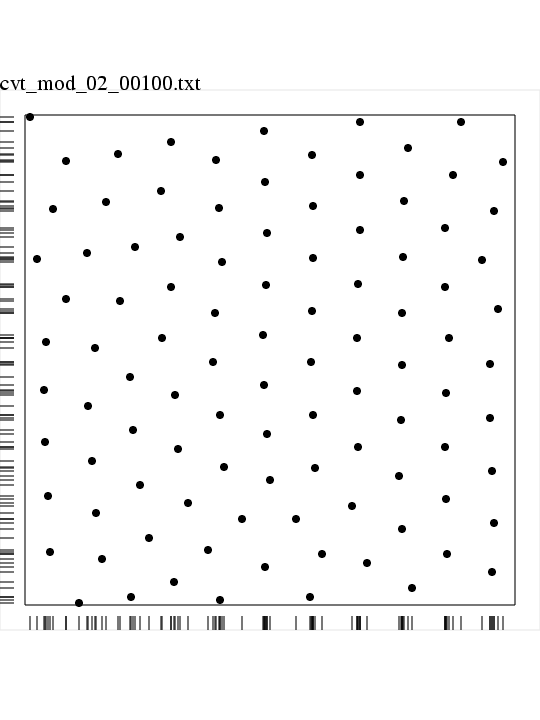
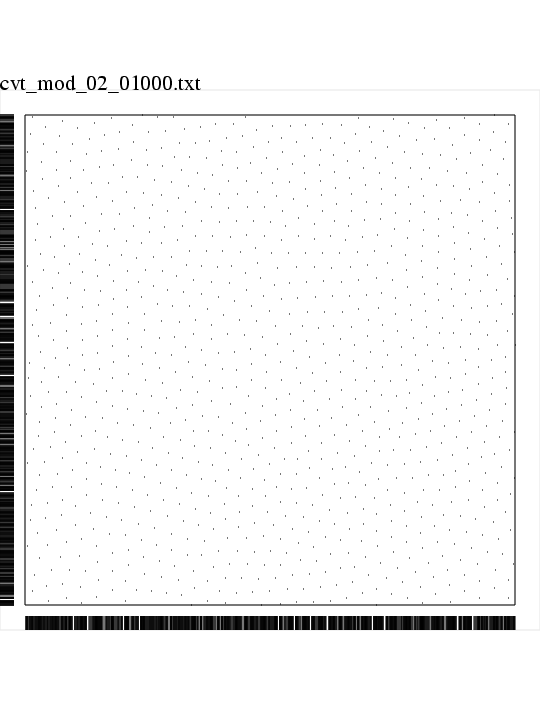
A typical (but small) dataset looks like this:
  0.378753  0.919641
  0.725977  0.572210
  0.551973  0.246525
  0.264802  0.248364
  0.052727  0.745158
  0.057432  0.457647
  0.395623  0.587517
  0.710814  0.904034
  0.839889  0.240473
  0.046507  0.033340
There is a family of datasets in M = 2 dimensions. At least for the lower values of N, it is useful to look at plots of this data.
There is a family of datasets in M = 7 dimensions.
There is a family of datasets in M = 16 dimensions.
You can go up one level to the DATASETS directory.