dislin_test, a C code which uses the dislin() scientific plotting package.
The graphics output from DISLIN can go to into a standard graphics file, or an interactive X Window screen, or into a generic DISLIN graphics metafile, for later processsing. The standard graphics file formats that DISLIN recognizes include:
When creating a graphics output file, please note that DISLIN will not overwrite an existing graphics file. Instead, it will store the new information in a file with the right extension, but a different "first name" than you specified. For example, if you run the first example, it will create the file "ex01.png". If you rerun the first example, the output will go into a file which DISLIN arbitrarily names "dislin_1.png". To override this behavior, you must call the filmod routine passing in the string "DELETE" first.
To use DISLIN, you must access the correct include file, DISLIN library file, and associated X libraries. The shell scripts that run the examples have been set up to take care of these steps at compile and load time. If you plan to use DISLIN, you will need to pay attention to the installation instructions so that you set up your environment correctly!
DISLIN is a plotting library, designed so that you can be generating data and creating plots at the same time. This necessarily means that you use the program by making many subroutine calls, to define the plot type, the plot size, the axis length, and so on. The examples below are one way to familiarize yourself with this procedure, and the manual has extensive explanations of how to make the plot you want.
If might be helpful, though, to note one feature of DISLIN, (which it shares with related plotting libraries such as the old DISSPLA library). The plotting library starts out at "level 0". Calling an initialization routine moves you to "level 1", at which point graphs can be defined. Defining a graph moves you to level 2, at which point you can also define features associated with the graph, such as axes. When you read the manual, you will see that some plotting routines are only allowed to be called when the plotting library has reached a specific level.
The information on this web page is distributed under the MIT license.
dislin_test is available in a C version and a C++ version and a Fortran90 version.
gnuplot_test, examples which illustrate the use of the gnuplot graphics program.
graphics_dislin_test, a C code which illustrates how various kinds of data can be displayed and analyzed graphically.
graphics_gnuplot_test, a C code which illustrates how various kinds of data can be displayed and analyzed graphically.
met, a data directory which contains examples of MET files, a graphics file format used by the DISLIN plotting package of Helmut Michels.
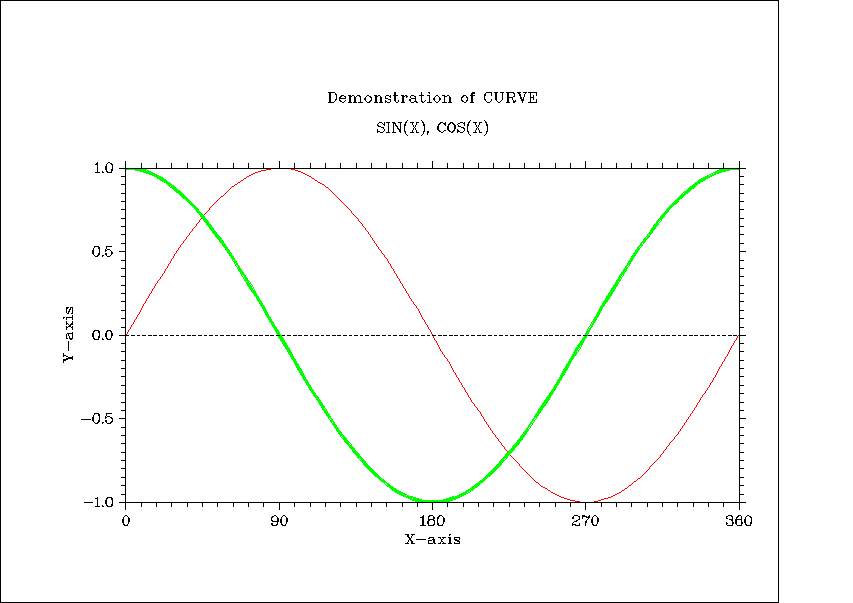
EX01 shows how to use the CURVE routine to plot sets of (X,Y) data:
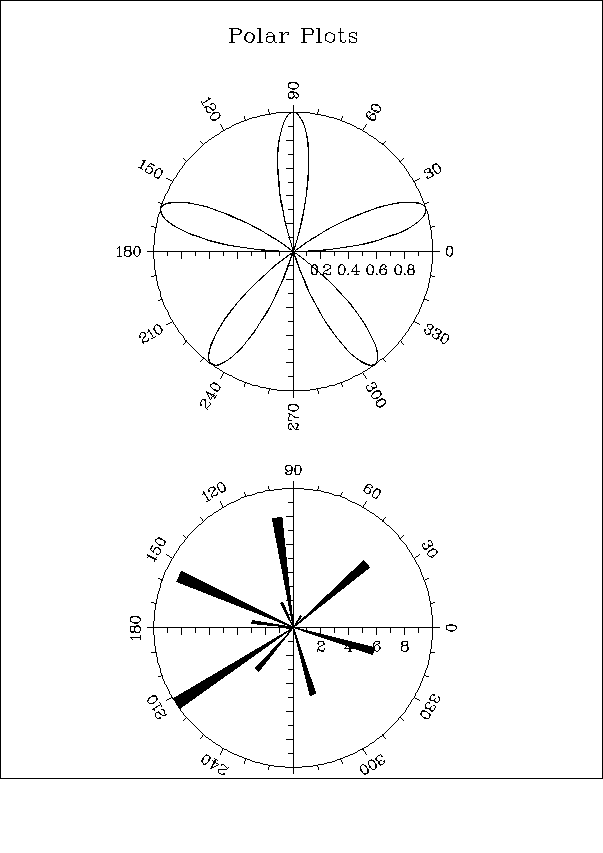
EX02 shows how to use the POLAR routine to plot (R,Theta) data:
EX03 shows how the SYMBOL routine can be used to generate symbols:
EX04 shows five ways of plotting the same X, Y data, using different interpolation methods.
EX05 shows three ways of plotting the same X, Y data, using different bar graph formats.
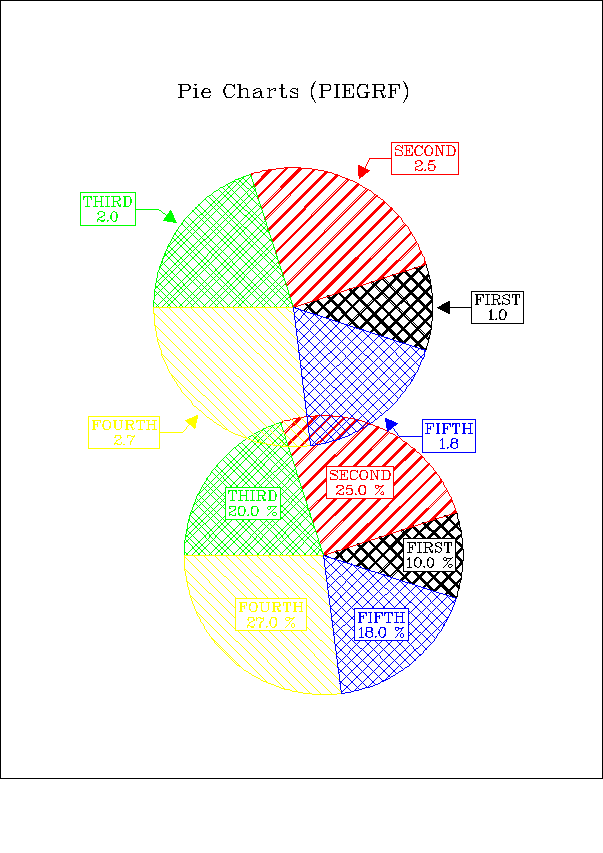
EX06 shows two ways of labeling data that is displayed as a piechart.
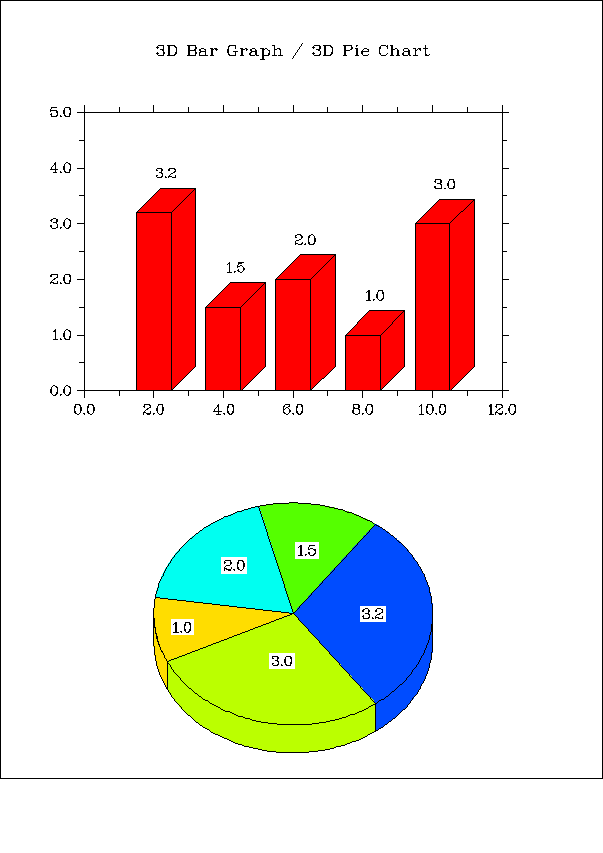
EX07 shows how to make pie charts and bar graphs that have a 3D thickness to them.
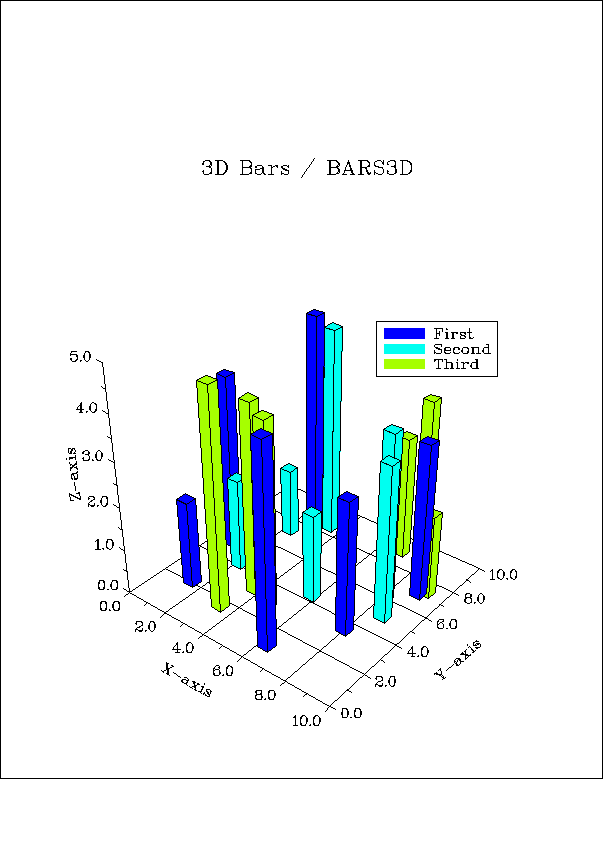
EX07B shows how to make 3D bar graphs on a 3D range.
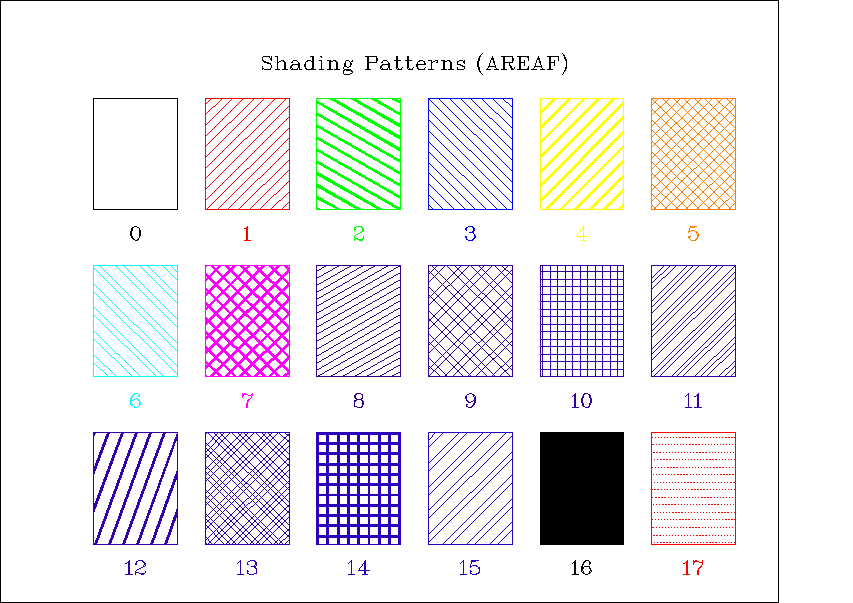
EX08 demonstrates available shading patterns.
EX09 demonstrates the use of color contour plots.
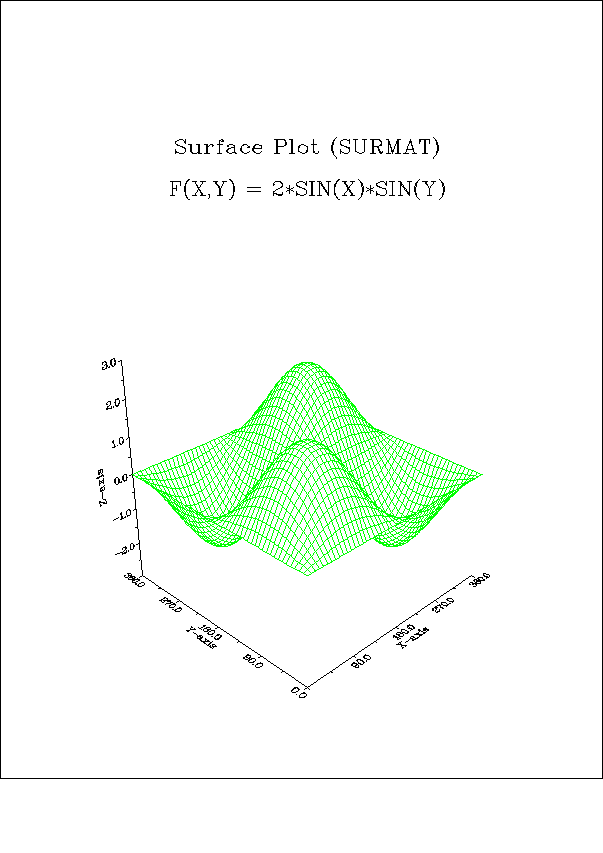
EX10 demonstrates the use of 3D surface (wiremesh) plots.
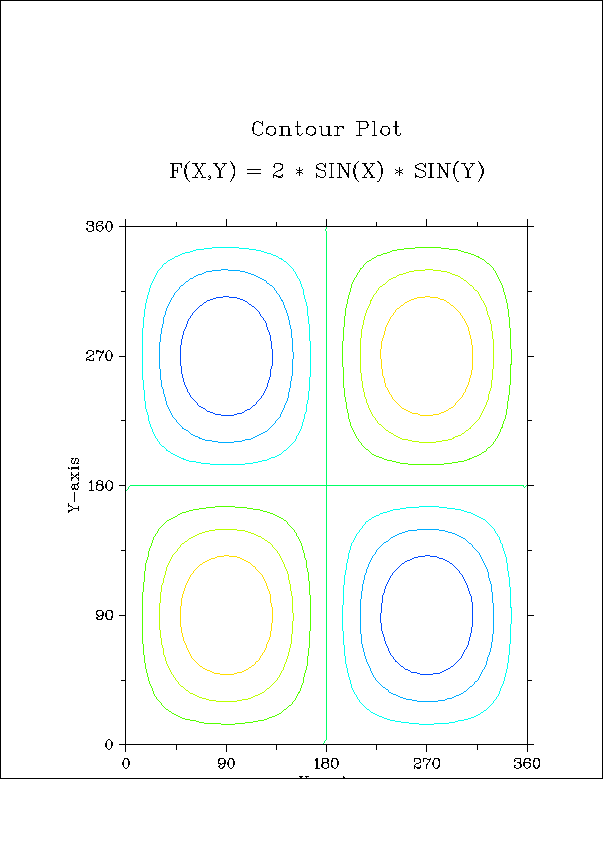
EX11 demonstrates the creation of a contour plot.
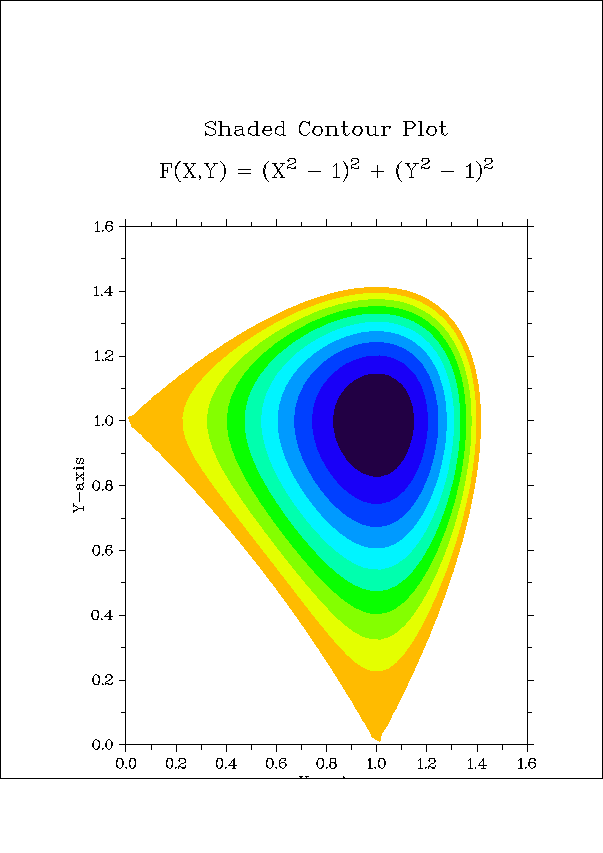
EX12 demonstrates the creation of a shaded contour plot.
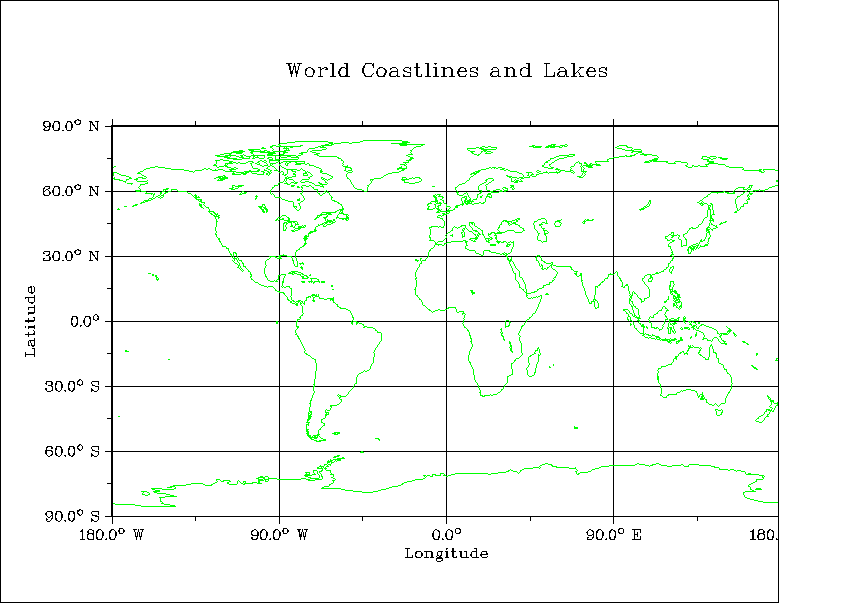
EX13 demonstrates the creation of a map plot.
EX14 demonstrates the use of TeX instructions to define mathematical formulas.
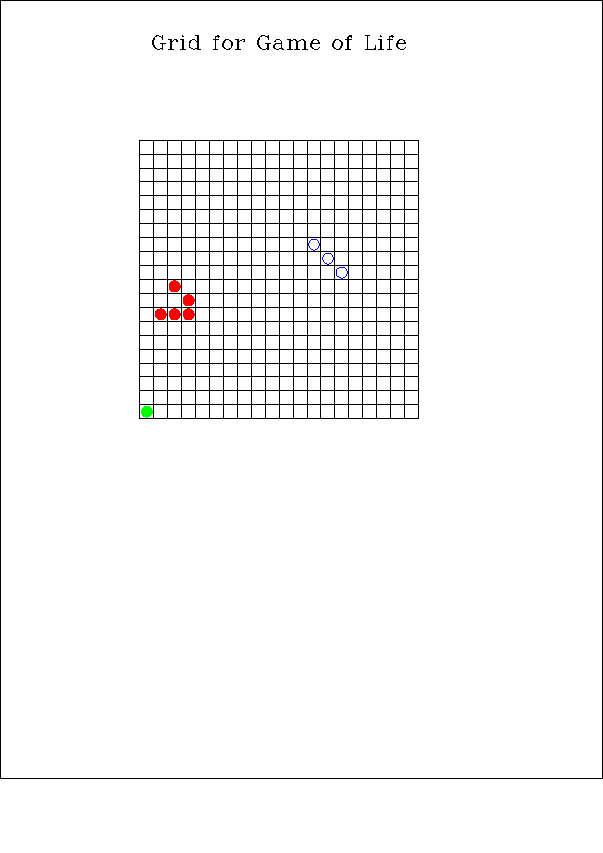
LIFE_GRID creates a simple grid for the game of Life.
QUICKPLOT_BAR calls QPLBAR to plot a bar chart or histogram.
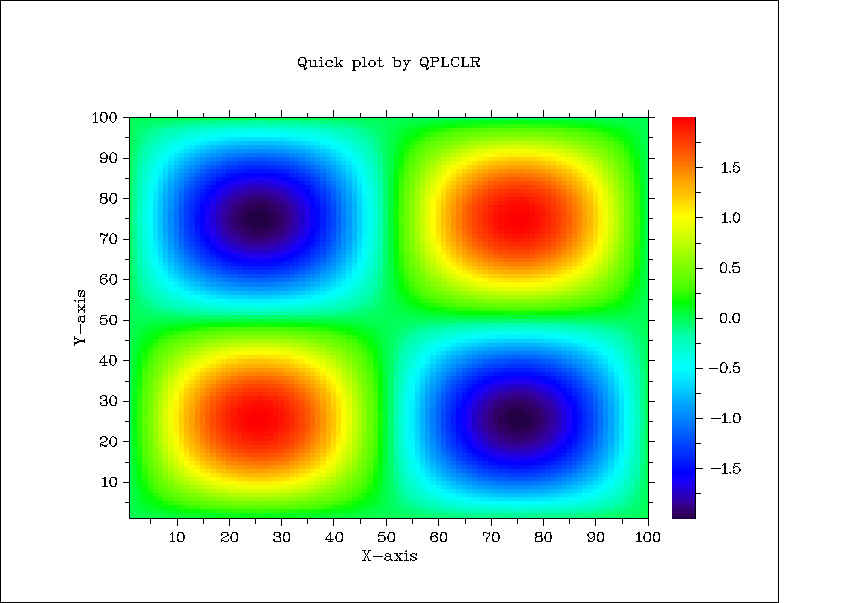
QUICKPLOT_COLOR calls QPLCLR to make a color plot of a matrix of data.
QUICKPLOT_CONTOUR calls QPLCON to make a contour plot of data Z(X,Y) stored as an array.
QUICKPLOT_CURVE calls QPLOT to plot a curve.
QUICKPLOT_PIE calls QPLPIE to plot a pie char.
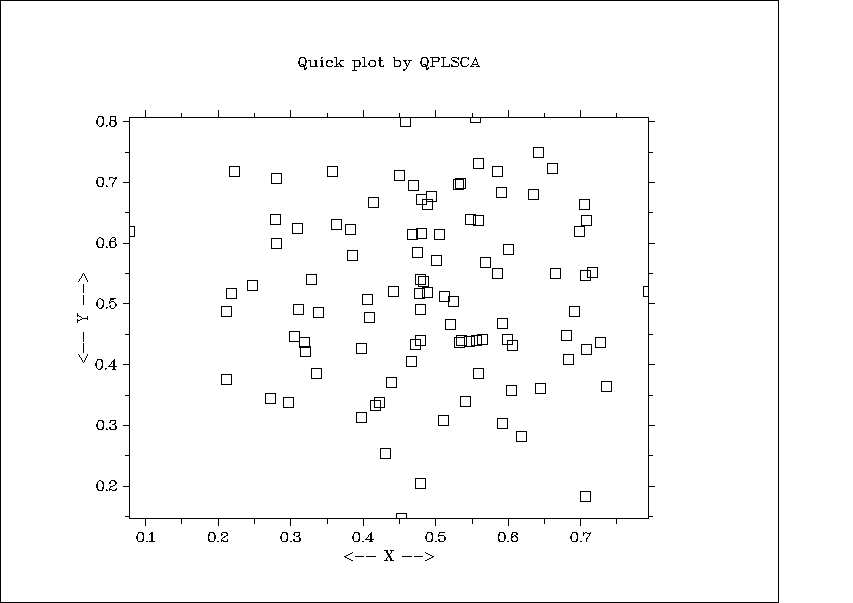
QUICKPLOT_SCATTER calls QPLSCA to make a scatterplot.
QUICKPLOT_SURFACE calls QPLSUR to make a 3D surface plot of data Z(X,Y) stored as an array.