lagrange_basis_display, a Python code which displays the basis functions associated with any set of interpolation points to be used for Lagrange interpolation.
The Lagrange interpolating polynomial to a set of m+1 data pairs (xi,yi) can be represented as
p(x) = sum ( 1 <= i <= m + 1 ) yi * l(i,x)
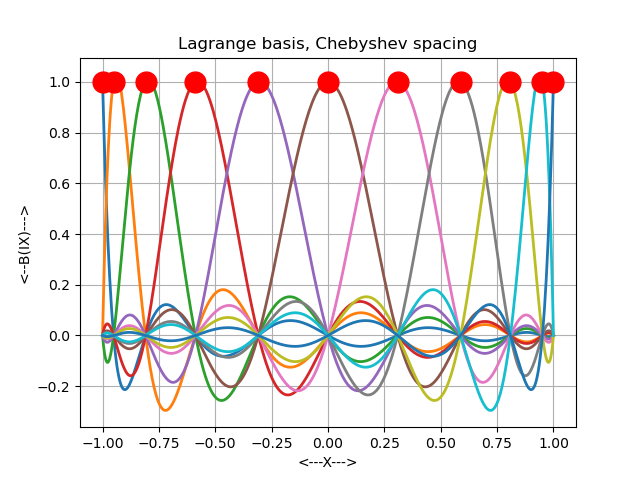
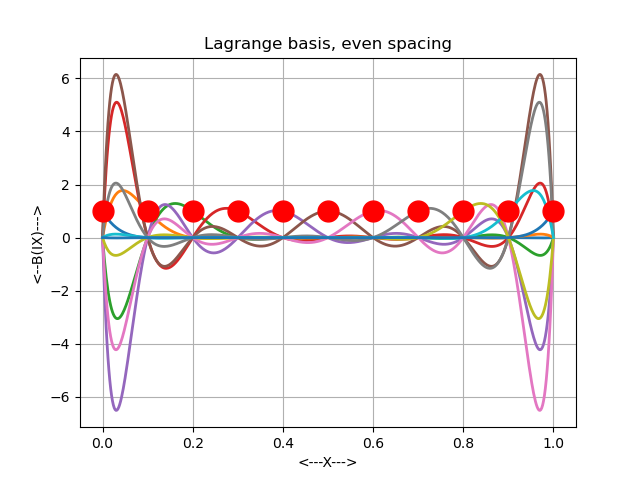
Each function l(i,x) is a Lagrange basis function associated with the
set of x data values. Each l(i,x) is a polynomial of degree m, which
is 1 at node xi and zero at the other nodes. Moreover, there is an
explicit formula:
        l(i,x) = product ( 1 <= j <= m + 1, j /= i ) ( x  - xj )
               / product ( 1 <= j <= m + 1, j /= i ) ( xi - xj )
Thus the interpolating polynomial can be represented as a linear combination
of the Lagrange basis functions, and the coefficients are simply the
data values yi.
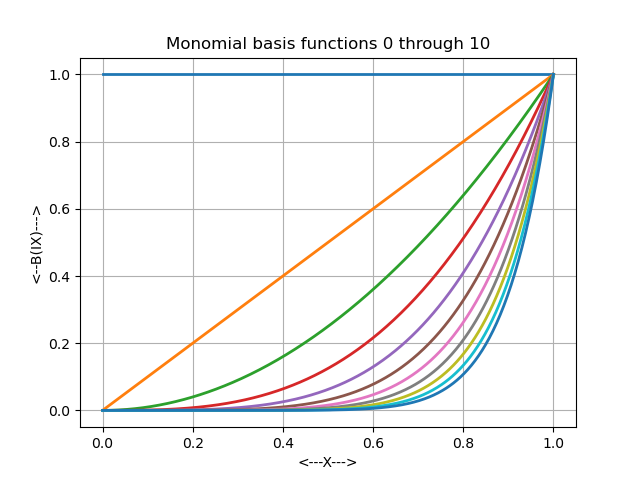
For a given set of m+1 data pairs (xi,yi), you may also define the same interpolating polynomial using a Vandermonde matrix; this approach essentially uses the monomials 1, x, x^2, ..., x^m as the basis functions. The unknown polynomial coefficients c must be determined by forming and solving the Vandermonde system; not only is this method more costly, but this linear system is numerically ill-conditioned, so that the resulting answers can be unreliable.
The information on this web page is distributed under the MIT license.
lagrange_basis_display is available in a MATLAB version and an Octave version and a Python version.
lagrange_interp_1d, a Python code which defines and evaluates the Lagrange polynomial p(x) which interpolates a set of data, so that p(x(i)) = y(i).
vandermonde_interp_1d, a Python code which finds a polynomial interpolant to data y(x) of a 1D argument, by setting up and solving a linear system for the polynomial coefficients, involving the Vandermonde matrix.
Plots made by the test include: