sir_simulation_test, a MATLAB code which calls sir_simulation(), which simulates the spread of a disease through a hospital room of M by N beds, using the SIR (Susceptible/Infected/Recovered) model.
The information on this web page is distributed under the MIT license.
sir_simulation, a MATLAB code which simulates the spread of a disease through a hospital room of M by N beds, using the Susceptible/Infected/Recovered (SIR) model.
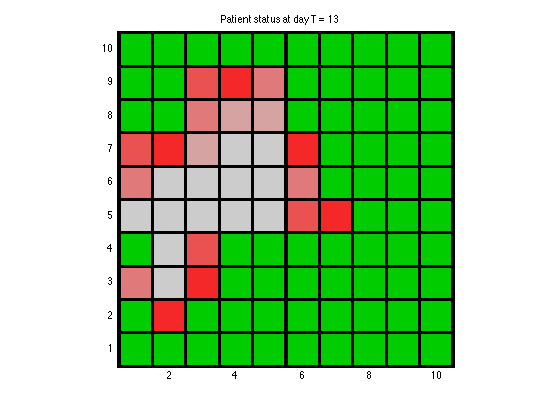
As the SIR_SIMULATION program runs, it displays a plot of the hospital room, with susceptibles in green, infecteds in shades of red, and recovereds in gray. Here is an example:
Using the command
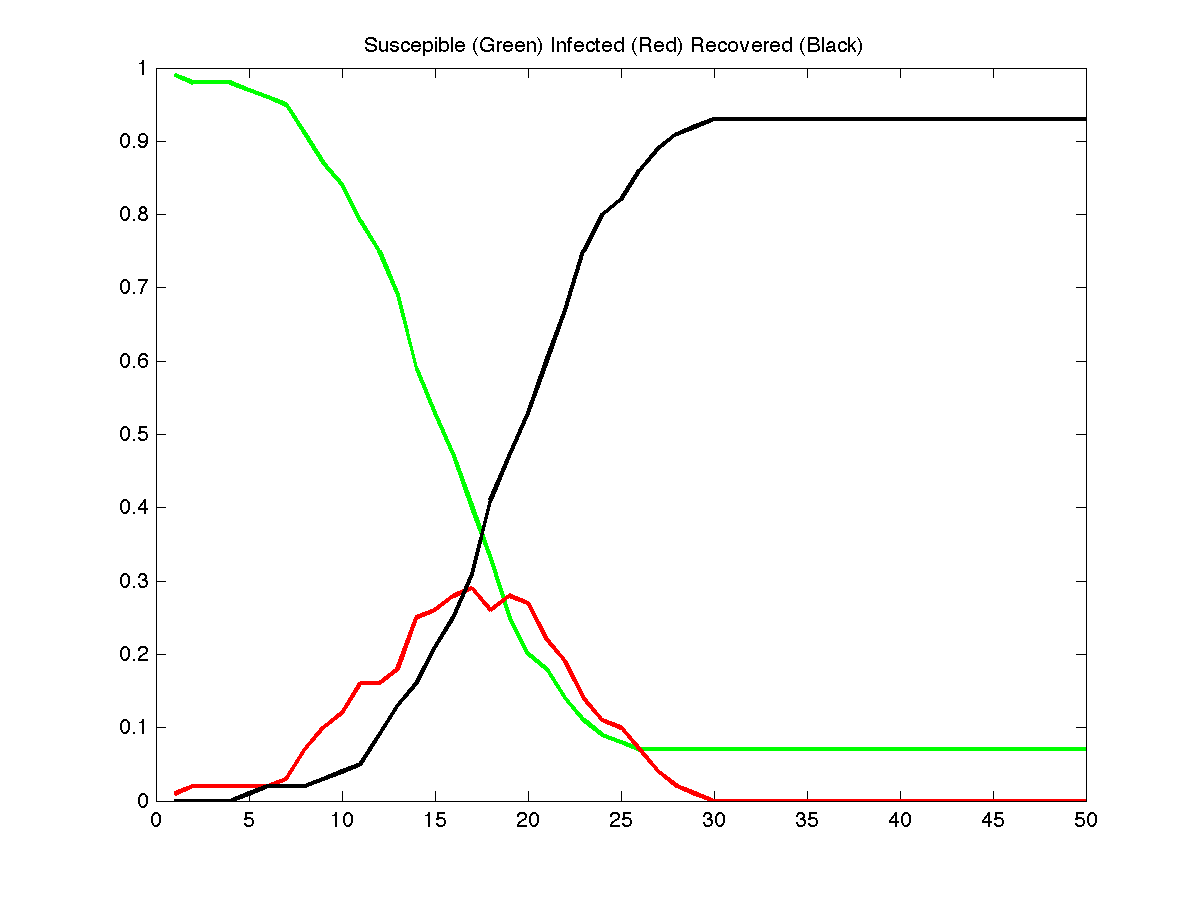
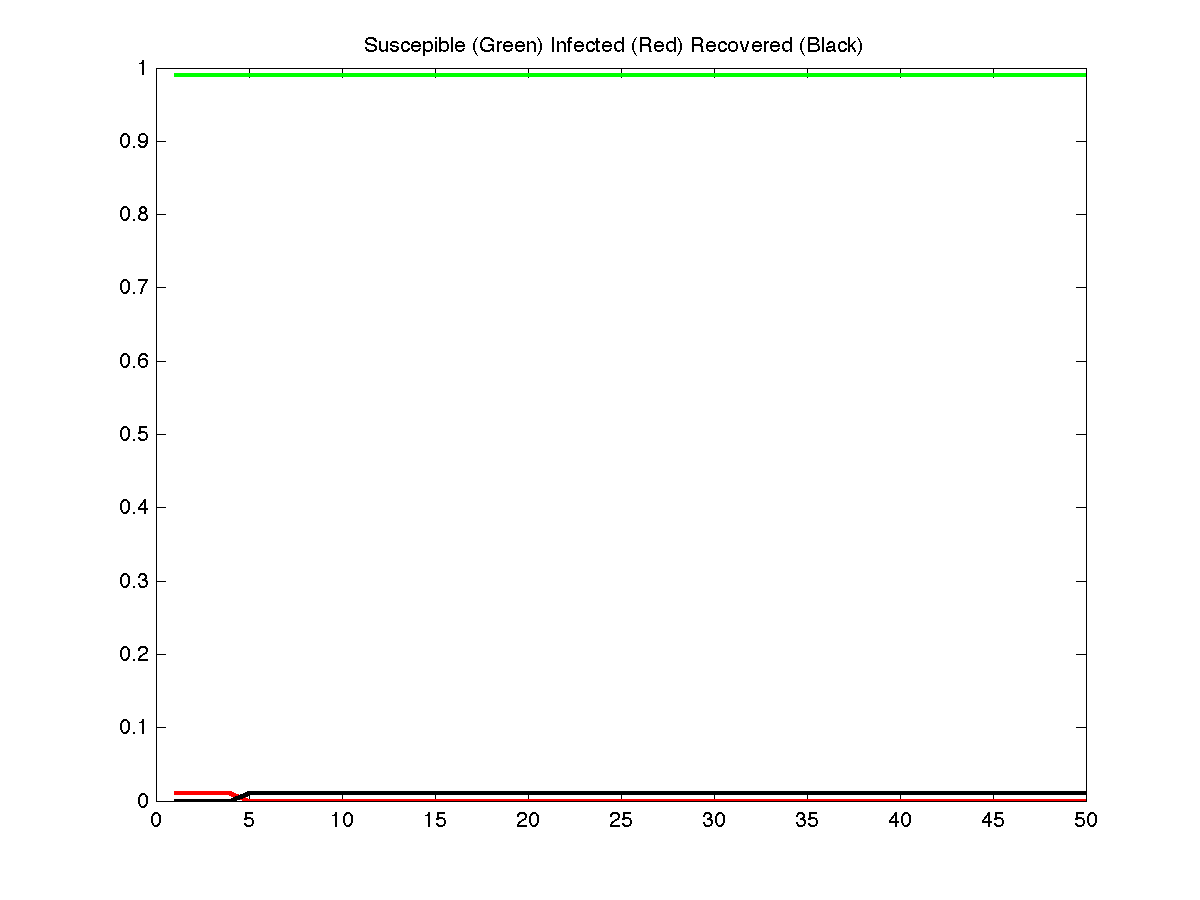
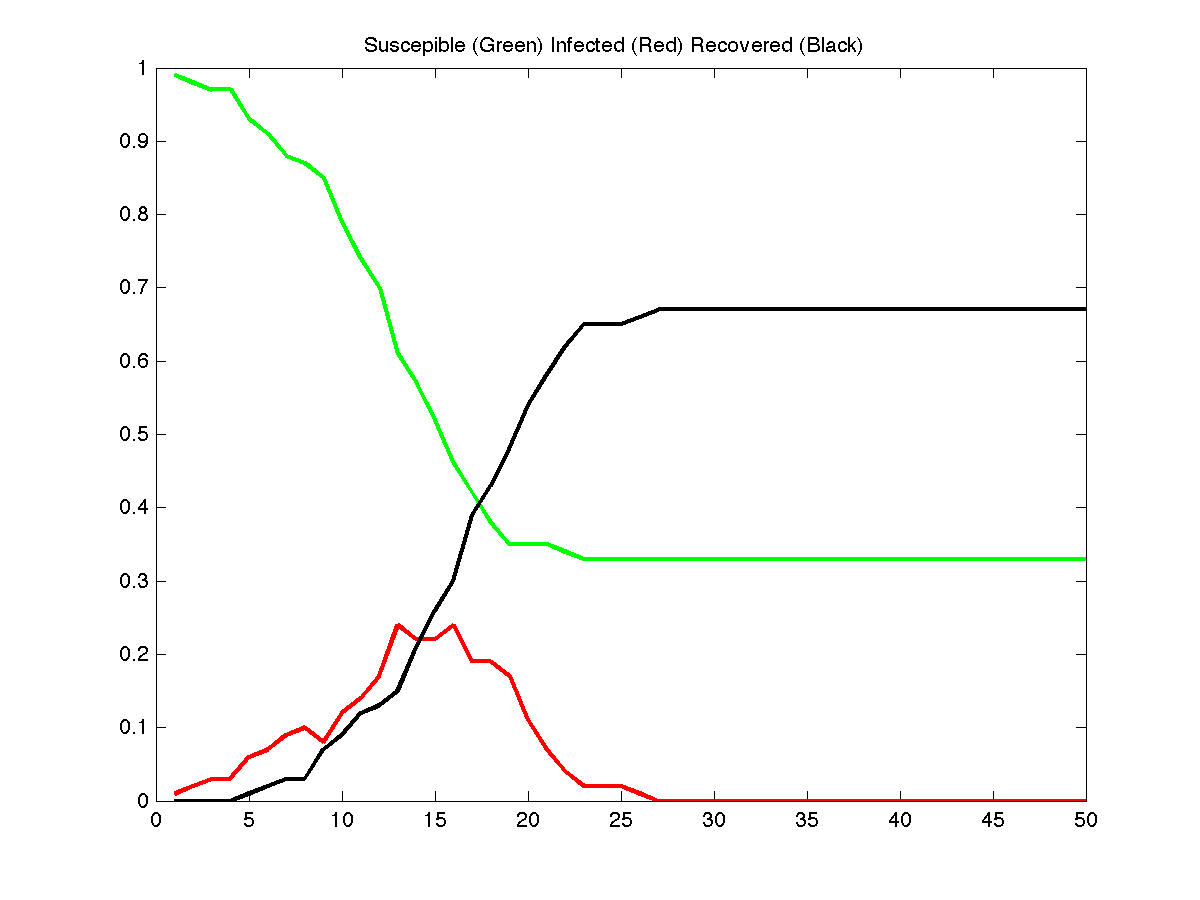
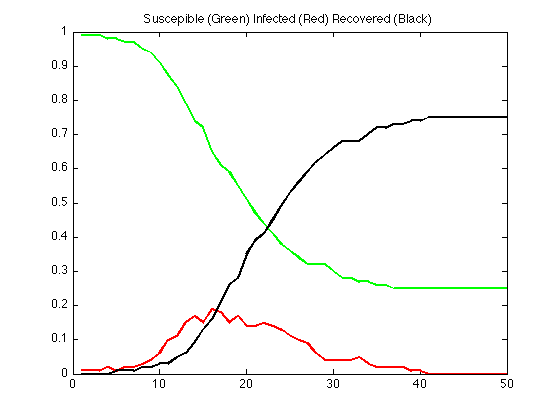
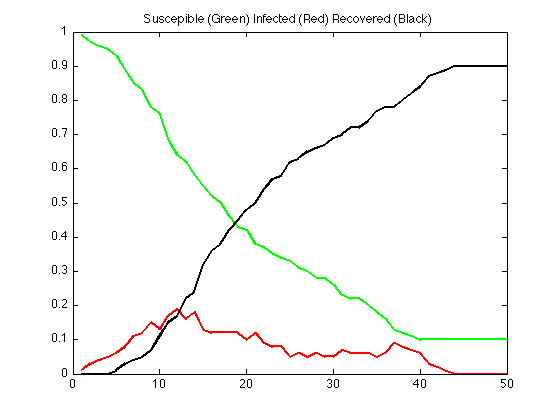
plot ( 1:t_max, sir(1,:), 'g', 1:t_max, sir(2,:), 'r', 1:t_max, sir(3,:), 'k' )
we can make line plots of the S, I and R populations. For M = N = 10,
a single infected patient at A(5,5), K = 4, TAU = 0.2, and T_MAX = 50,
we did this several times:
Using the commands
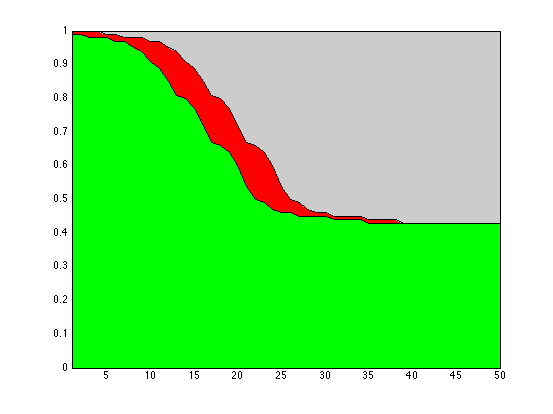
      h = areas ( sir' );
      set ( h(1), 'FaceColor', [ 0, 1, 0 ] );
      set ( h(2), 'FaceColor', [ 1, 0, 0 ] );
      set ( h(3), 'FaceColor', [ 0.8, 0.8, 0.8 ] );
we can make an area plot of the S, I and R populations. For M = N = 10,
a single infected patient at A(5,5), K = 4, TAU = 0.2, and T_MAX = 50,
we did this: