grids_display_test
grids_display_test,
a MATLAB code which
calls grids_display(), which
reads two ASCII
files defining grids or sparse grids in 2D or 3D. The first grid is
plotted "lightly", in hollow blue dots, while the second is plotted
with solid red dots. The image is automatically
saved to a PNG file.
Licensing:
The information on this web page is distributed under the MIT license.
Related Data and Programs:
grids_display,
a MATLAB code which
reads two files of grids or sparse grids, displays the first with
hollow blue dots, the second with red dots.
Source Code:
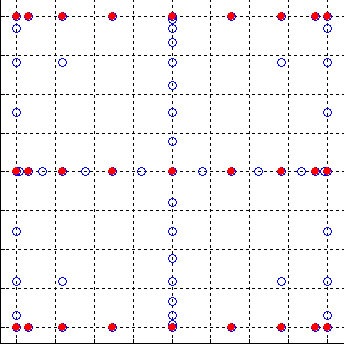
A 2D example which illustrates how a Clenshaw Curtis sparse grid of
level 4 is the sum of 5 Clenshaw Curtis product grids:
-
cc_d2_level4_x.txt,
the coordinates of points in a Clenshaw Curtis sparse grid of
level 4.
-
cc_d2_o17x1_x.txt,
the coordinates of points in a Clenshaw Curtis 17x1 product grid.
-
level4_o17x1.png,
a plot with the level 4 points in hollow blue and the 17x1
points in solid red.
-
cc_d2_o9x3_x.txt,
the coordinates of points in a Clenshaw Curtis 9x3 product grid.
-
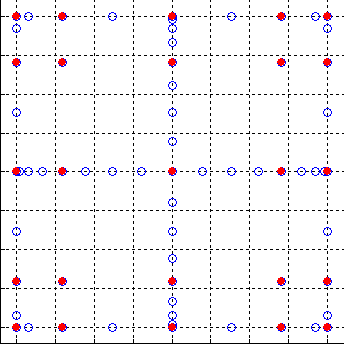
level4_o9x3.png,
a plot with the level 4 points in hollow blue and the 9x3
points in solid red.
-
cc_d2_o5x5_x.txt,
the coordinates of points in a Clenshaw Curtis 5x5 product grid.
-
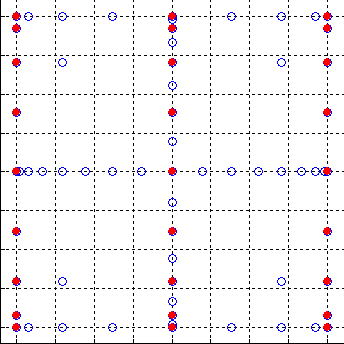
level4_o5x5.png,
a plot with the level 4 points in hollow blue and the 5x5
points in solid red.
-
cc_d2_o3x9_x.txt,
the coordinates of points in a Clenshaw Curtis 3x9 product grid.
-
level4_o3x9.png,
a plot with the level 4 points in hollow blue and the 3x9
points in solid red.
-
cc_d2_o1x17_x.txt,
the coordinates of points in a Clenshaw Curtis 1x17 product grid.
-
level4_o1x17.png,
a plot with the level 4 points in hollow blue and the 1x17
points in solid red.
Last revised on 24 January 2019.