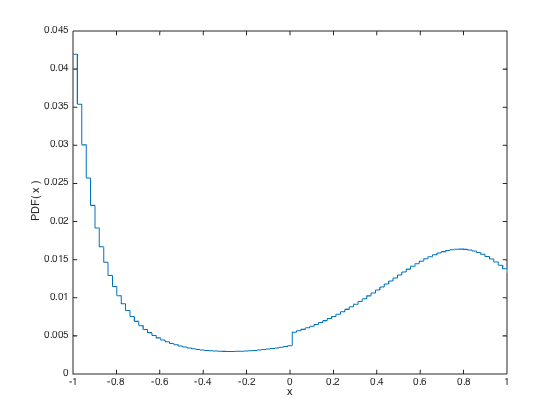
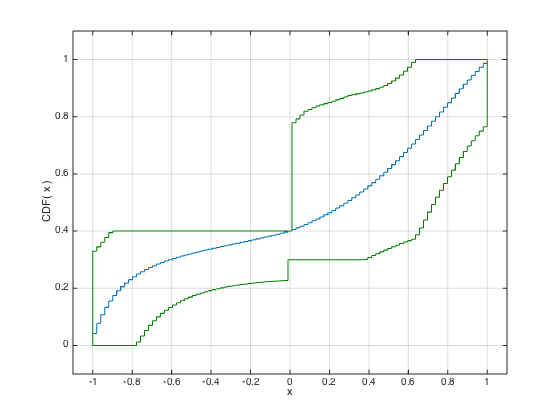
n = 100;
a = linspace(-1,1,n);
a2 = a .^ 2;
a3 = 3 * ( a.^ 3 ) - 2 * a;
ap = +( a < 0 );
A = [ a ; -a ; a2 ; -a2 ; a3 ; -a3 ; ap ; -ap ];
b = [ 0.1 ; 0.1 ;0.5 ; -0.5 ; -0.2 ; 0.3 ; 0.4 ; -0.3 ];
cvx_expert true
cvx_begin
variables pent(n)
maximize( sum(entr(pent)) )
sum(pent) == 1;
A * pent <= b;
cvx_end
Ubnds = zeros(1,n);
Lbnds = zeros(1,n);
for t = 1 : n,
cvx_begin quiet
variable p( n )
minimize sum( p(1:t) )
p >= 0;
sum( p ) == 1;
A * p <= b;
cvx_end
Lbnds(t) = cvx_optval;
cvx_begin quiet
variable p( n )
maximize sum( p(1:t) )
p >= 0;
sum( p ) == 1;
A * p <= b;
cvx_end
Ubnds(t) = cvx_optval;
disp( sprintf( '%g <= Prob(x<=%g) <= %g', Lbnds(t), a(t), Ubnds(t) ) );
end
figure( 1 )
stairs( a, pent );
xlabel( 'x' );
ylabel( 'PDF( x )' );
figure( 2 )
stairs( a, cumsum( pent ) );
grid on;
hold on
d = stairs(a, Lbnds,'r-'); set(d,'Color',[0 0.5 0]);
d = stairs(a, Ubnds,'r-'); set(d,'Color',[0 0.5 0]);
d = plot([-1,-1], [Lbnds(1), Ubnds(1)],'r-');
set(d,'Color',[0 0.5 0]);
axis([-1.1 1.1 -0.1 1.1]);
xlabel( 'x' );
ylabel( 'CDF( x )' );
hold off
Successive approximation method to be employed.
   SDPT3 will be called several times to refine the solution.
   Original size: 308 variables, 109 equality constraints
   100 exponentials add 800 variables, 500 equality constraints
-----------------------------------------------------------------
 Cones  |             Errors              |
Mov/Act | Centering  Exp cone   Poly cone | Status
--------+---------------------------------+---------
100/100 | 7.368e+00  2.690e+00  0.000e+00 | Solved
100/100 | 1.280e+00  1.428e-01  0.000e+00 | Solved
100/100 | 2.345e-01  4.365e-03  0.000e+00 | Solved
 99/ 99 | 2.735e-02  5.851e-05  0.000e+00 | Solved
 96/ 98 | 2.851e-03  5.894e-07  0.000e+00 | Solved
  0/  0 | 0.000e+00  0.000e+00  0.000e+00 | Solved
-----------------------------------------------------------------
Status: Solved
Optimal value (cvx_optval): +4.38629

2.26172e-11 <= Prob(x<=-1) <= 0.329406
2.88711e-11 <= Prob(x<=-0.979798) <= 0.344777
2.25055e-10 <= Prob(x<=-0.959596) <= 0.360771
1.63251e-10 <= Prob(x<=-0.939394) <= 0.377365
9.05212e-12 <= Prob(x<=-0.919192) <= 0.394532
4.78858e-11 <= Prob(x<=-0.89899) <= 0.4
2.63852e-11 <= Prob(x<=-0.878788) <= 0.4
6.29578e-11 <= Prob(x<=-0.858586) <= 0.4
5.85922e-10 <= Prob(x<=-0.838384) <= 0.4
4.11204e-11 <= Prob(x<=-0.818182) <= 0.4
2.53223e-10 <= Prob(x<=-0.79798) <= 0.4
0.0116304 <= Prob(x<=-0.777778) <= 0.4
0.0331953 <= Prob(x<=-0.757576) <= 0.4
0.0519157 <= Prob(x<=-0.737374) <= 0.4
0.0701091 <= Prob(x<=-0.717172) <= 0.4
0.0859495 <= Prob(x<=-0.69697) <= 0.4
0.0998612 <= Prob(x<=-0.676768) <= 0.4
0.112141 <= Prob(x<=-0.656566) <= 0.4
0.123045 <= Prob(x<=-0.636364) <= 0.4
0.132778 <= Prob(x<=-0.616162) <= 0.4
0.141527 <= Prob(x<=-0.59596) <= 0.4
0.149418 <= Prob(x<=-0.575758) <= 0.4
0.15655 <= Prob(x<=-0.555556) <= 0.4
0.163015 <= Prob(x<=-0.535354) <= 0.4
0.168895 <= Prob(x<=-0.515152) <= 0.4
0.174283 <= Prob(x<=-0.494949) <= 0.4
0.179205 <= Prob(x<=-0.474747) <= 0.4
0.18371 <= Prob(x<=-0.454545) <= 0.4
0.187841 <= Prob(x<=-0.434343) <= 0.4
0.191651 <= Prob(x<=-0.414141) <= 0.4
0.195164 <= Prob(x<=-0.393939) <= 0.4
0.198396 <= Prob(x<=-0.373737) <= 0.4
0.201373 <= Prob(x<=-0.353535) <= 0.4
0.204127 <= Prob(x<=-0.333333) <= 0.4
0.206681 <= Prob(x<=-0.313131) <= 0.4
0.209037 <= Prob(x<=-0.292929) <= 0.4
0.211209 <= Prob(x<=-0.272727) <= 0.4
0.213219 <= Prob(x<=-0.252525) <= 0.4
0.215088 <= Prob(x<=-0.232323) <= 0.4
0.216811 <= Prob(x<=-0.212121) <= 0.4
0.218398 <= Prob(x<=-0.191919) <= 0.4
0.219862 <= Prob(x<=-0.171717) <= 0.4
0.221224 <= Prob(x<=-0.151515) <= 0.4
0.222474 <= Prob(x<=-0.131313) <= 0.4
0.223619 <= Prob(x<=-0.111111) <= 0.4
0.224669 <= Prob(x<=-0.0909091) <= 0.4
0.225643 <= Prob(x<=-0.0707071) <= 0.4
0.22653 <= Prob(x<=-0.0505051) <= 0.4
0.227334 <= Prob(x<=-0.030303) <= 0.4
0.3 <= Prob(x<=-0.010101) <= 0.4
0.3 <= Prob(x<=0.010101) <= 0.778942
0.3 <= Prob(x<=0.030303) <= 0.792532
0.3 <= Prob(x<=0.0505051) <= 0.806483
0.3 <= Prob(x<=0.0707071) <= 0.819022
0.3 <= Prob(x<=0.0909091) <= 0.825
0.3 <= Prob(x<=0.111111) <= 0.83125
0.3 <= Prob(x<=0.131313) <= 0.837791
0.3 <= Prob(x<=0.151515) <= 0.841937
0.3 <= Prob(x<=0.171717) <= 0.845957
0.3 <= Prob(x<=0.191919) <= 0.850137
0.3 <= Prob(x<=0.212121) <= 0.854492
0.3 <= Prob(x<=0.232323) <= 0.859052
0.3 <= Prob(x<=0.252525) <= 0.863811
0.3 <= Prob(x<=0.272727) <= 0.868817
0.3 <= Prob(x<=0.292929) <= 0.874066
0.3 <= Prob(x<=0.313131) <= 0.877055
0.3 <= Prob(x<=0.333333) <= 0.880067
0.3 <= Prob(x<=0.353535) <= 0.883272
0.300787 <= Prob(x<=0.373737) <= 0.886687
0.307695 <= Prob(x<=0.393939) <= 0.890333
0.314397 <= Prob(x<=0.414141) <= 0.894234
0.320909 <= Prob(x<=0.434343) <= 0.898418
0.327232 <= Prob(x<=0.454545) <= 0.902981
0.333379 <= Prob(x<=0.474747) <= 0.909013
0.339323 <= Prob(x<=0.494949) <= 0.916606
0.345134 <= Prob(x<=0.515152) <= 0.925292
0.350719 <= Prob(x<=0.535354) <= 0.935184
0.356201 <= Prob(x<=0.555556) <= 0.946304
0.361491 <= Prob(x<=0.575758) <= 0.958921
0.366603 <= Prob(x<=0.59596) <= 0.973265
0.371622 <= Prob(x<=0.616162) <= 0.989508
0.387329 <= Prob(x<=0.636364) <= 1
0.410495 <= Prob(x<=0.656566) <= 1
0.439031 <= Prob(x<=0.676768) <= 1
0.466372 <= Prob(x<=0.69697) <= 1
0.492663 <= Prob(x<=0.717172) <= 1
0.518025 <= Prob(x<=0.737374) <= 1
0.542592 <= Prob(x<=0.757576) <= 1
0.56651 <= Prob(x<=0.777778) <= 1
0.589941 <= Prob(x<=0.79798) <= 1
0.613125 <= Prob(x<=0.818182) <= 1
0.635881 <= Prob(x<=0.838384) <= 1
0.657609 <= Prob(x<=0.858586) <= 1
0.678314 <= Prob(x<=0.878788) <= 1
0.697846 <= Prob(x<=0.89899) <= 1
0.716238 <= Prob(x<=0.919192) <= 1
0.733536 <= Prob(x<=0.939394) <= 1
0.74974 <= Prob(x<=0.959596) <= 1
0.764914 <= Prob(x<=0.979798) <= 1
1 <= Prob(x<=1) <= 1


