uq_2012_siam
uq_2012_siam,
"Collocation for Uncertainty Quantification",
a talk at the SIAM conference on Uncertainty Quantification,
held in Raleigh, North Carolina from 2 April 2012 to 06 April 2012.
The talk was part III of a tutorial called
"Analysis of SPDE's and Numerical Methods for UQ", prepared and presented
mainly by Clayton Webster.
The following files were used:
-
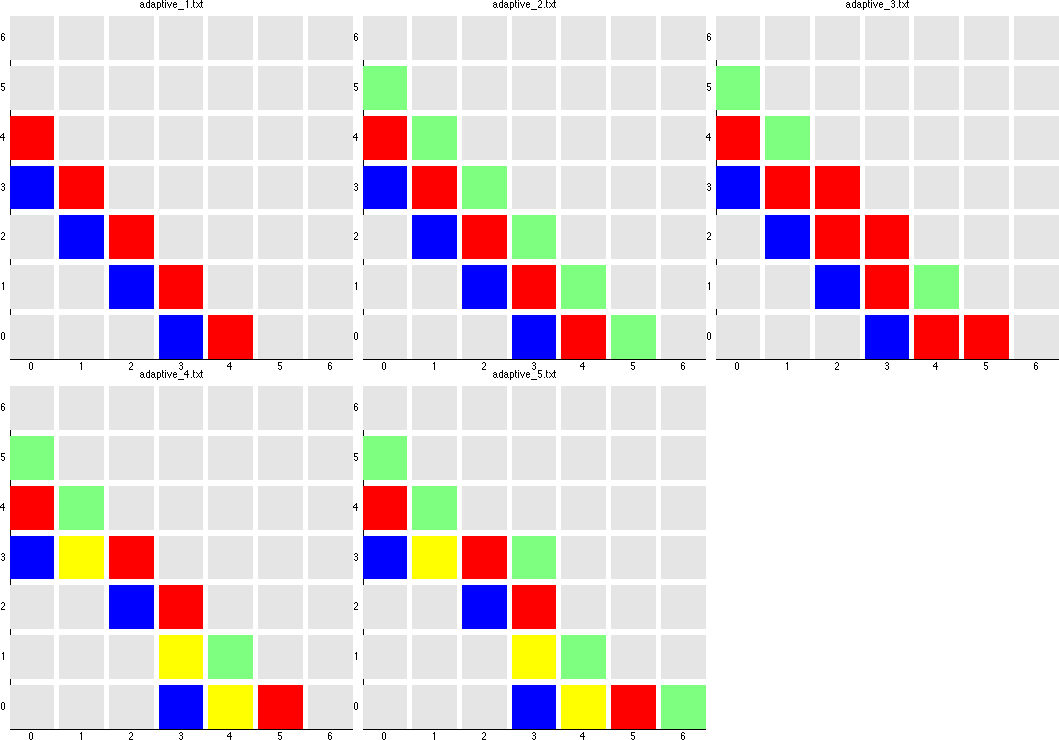
adaptive.png,
5 images suggesting the development of an adaptive grid.
-
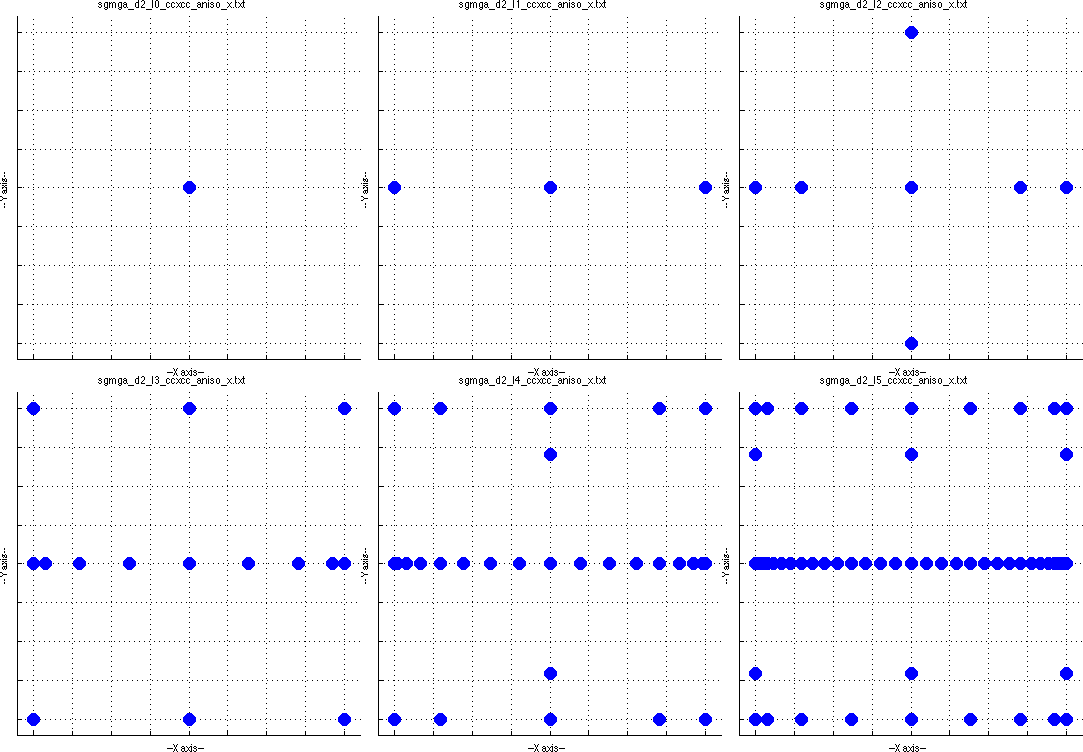
aniso_grids.png,
the abscissas of a sequence of 5 anisotropic grids.
-
aniso_nine.png,
9 images showing the developement of a sequence of anisotropic grids.
-
casl_logo.png,
a logo for CASL.
-
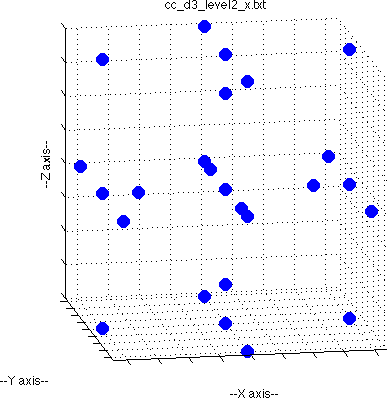
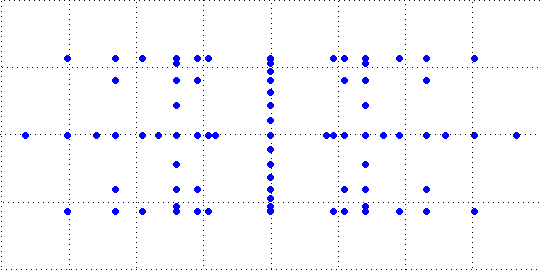
cc_d3_level2.png,
the abscissas of the level 2, dimension 3 Clenshaw Curtis sparse grid.
-
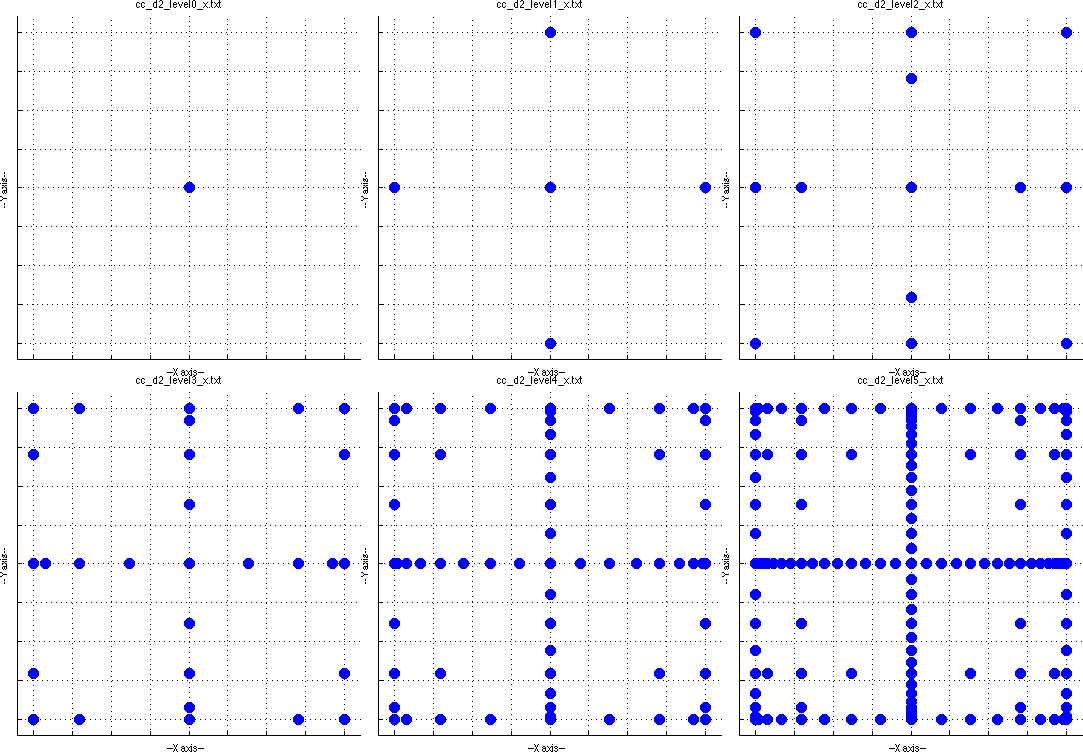
cc_grid_sequence.png,
displays 2D Clenshaw-Curtis sparse grids of levels 0, 1, 2, 3, 4 and 5.
-
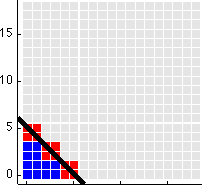
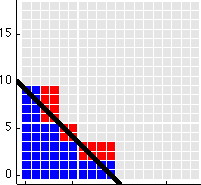
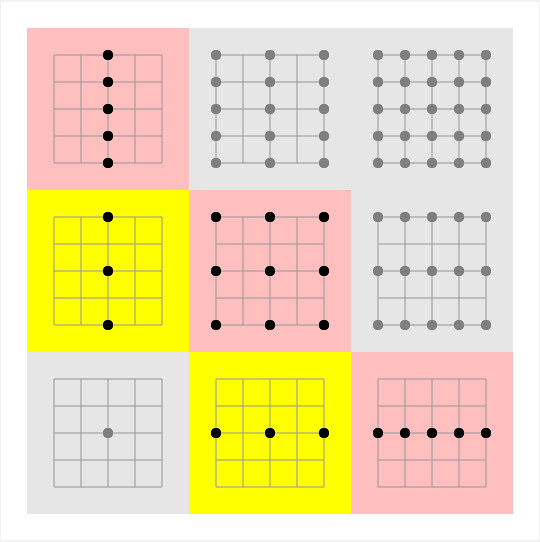
cc_level2_closeup.png,
the precision of the level 2, dimension 2 Clenshaw Curtis sparse grid.
-
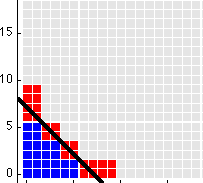
cc_level3_closeup.png,
the precision of the level 3, dimension 2 Clenshaw Curtis sparse grid.
-
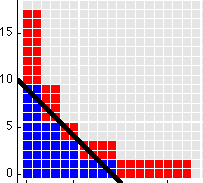
cc_level4_closeup.png,
the precision of the level 4, dimension 2 Clenshaw Curtis sparse grid.
-
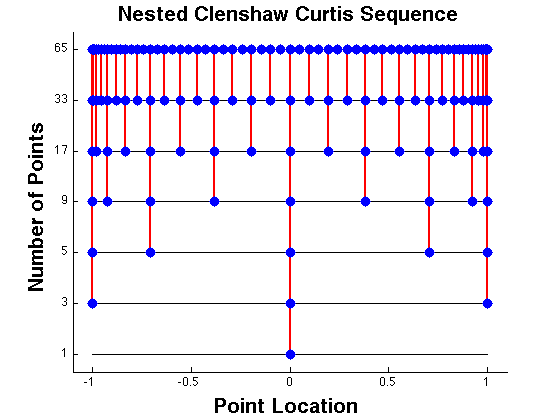
cc_sequence.png,
displays the nesting behavior of the chosen set of Clenshaw Curtis rules.
-
ccs_level4_closeup.png,
the precision of the level 4, dimension 2 "slow" Clenshaw Curtis sparse grid.
-
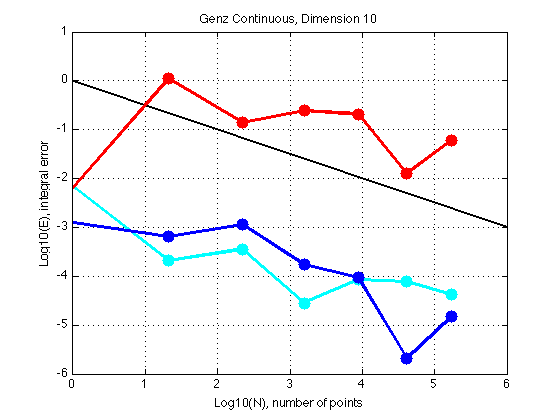
d10_con.png,
integration test with Genz "Continous" function for dimension 10.
-
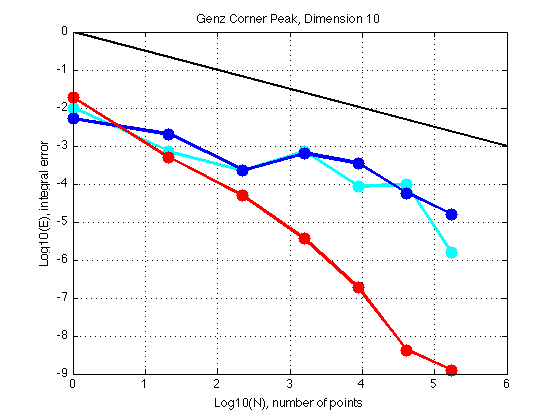
d10_cpeak.png,
integration test with Genz "Corner Peak" function for dimension 10.
-
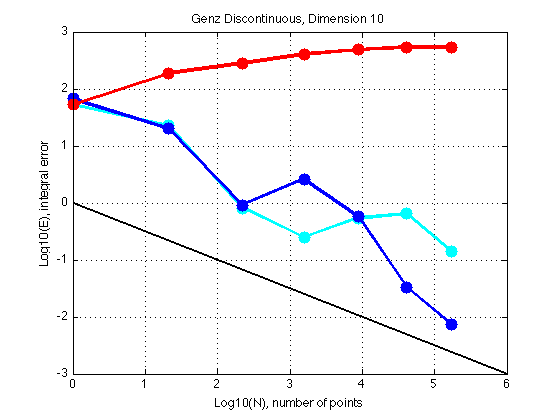
d10_discon.png,
integration test with Genz "Discontinous" function for dimension 10.
-
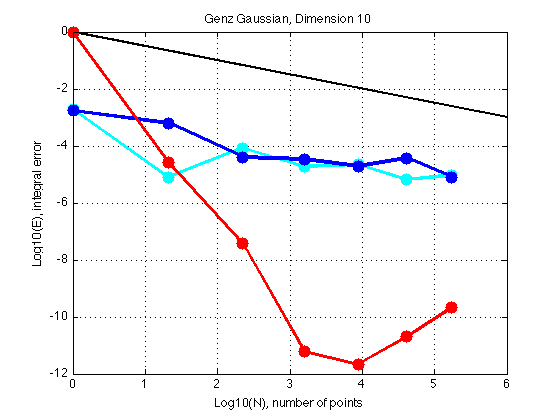
d10_gauss.png,
integration test with Genz "Gaussian" function for dimension 10.
-
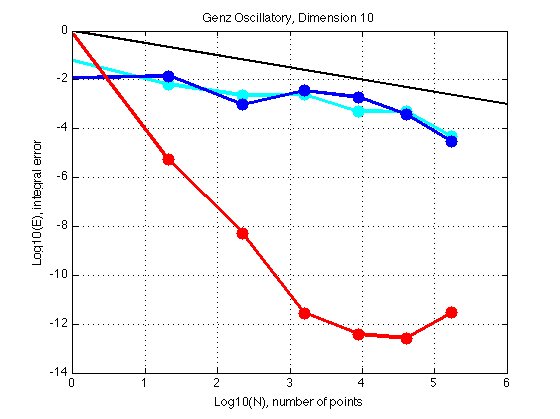
d10_oscill.png,
integration test with Genz "Oscillatory" function for dimension 10.
-
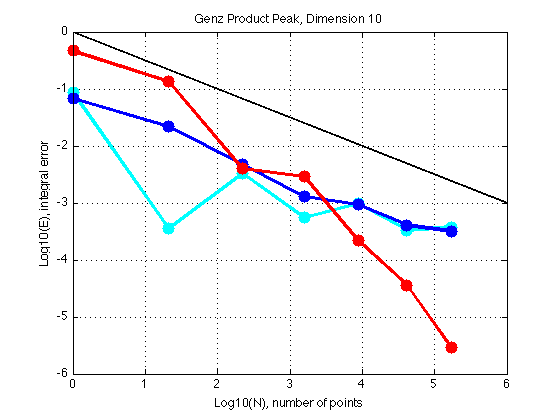
d10_ppeak.png,
integration test with Genz "Product Peak" function for dimension 10.
-
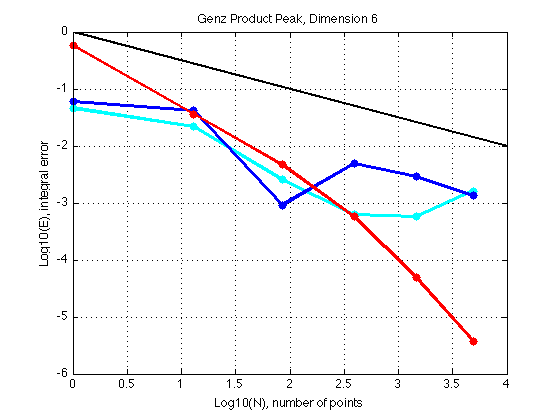
d6_ppeak.png,
integration test with Genz "Product Peak" function for dimension 6.
-
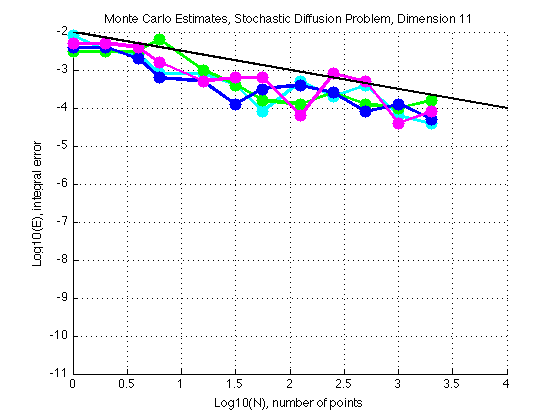
diffusion_mc.png, error plots for the diffusion equation, Monte Carlo estimates.
-
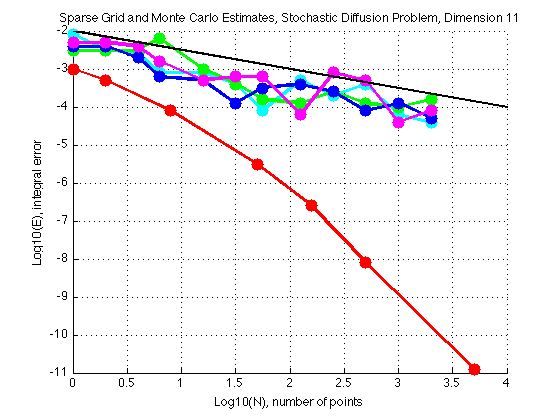
diffusion_mc_and_sg.png,
error plots for the diffusion equation, Monte Carlo and sparse grid estimates.
-
fsu_logo.pdf,
a logo for FSU.
-
ghxcc_level4.png, a plot of a 2D sparse grid formed from Gauss Hermite
rules in X and Clenshaw Curtis rules in Y.
-
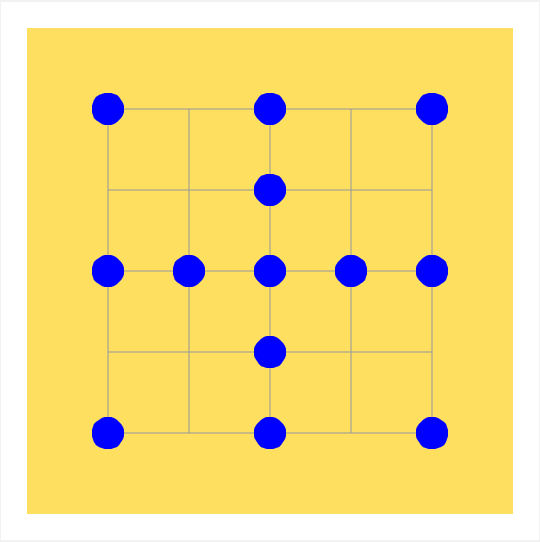
grid_04.png, the abscissas of the sparse grid A(2,2).
-
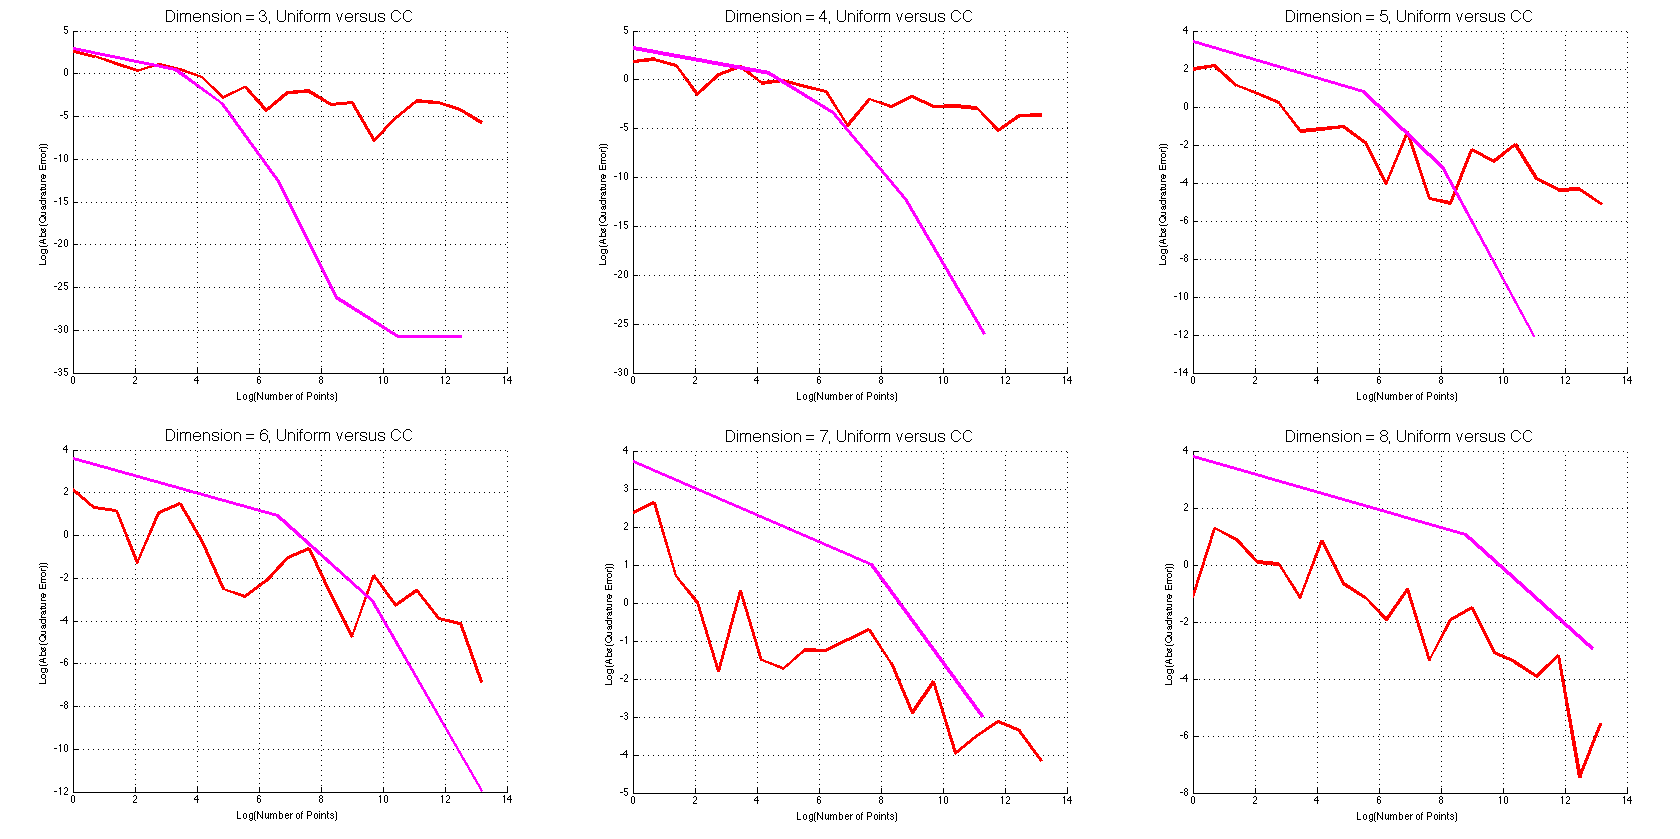
increasing_dimension_cc.png,
the (increasing) quadrature error for a Clenshaw Curtis sparse grid
in dimensions 3, 4, 5, 6, 7, and 8.
-
interp.m, a MATLAB program for computing constant, linear and quadratic
interpolants to data, and computing the quadrature error made by integrating each.
-
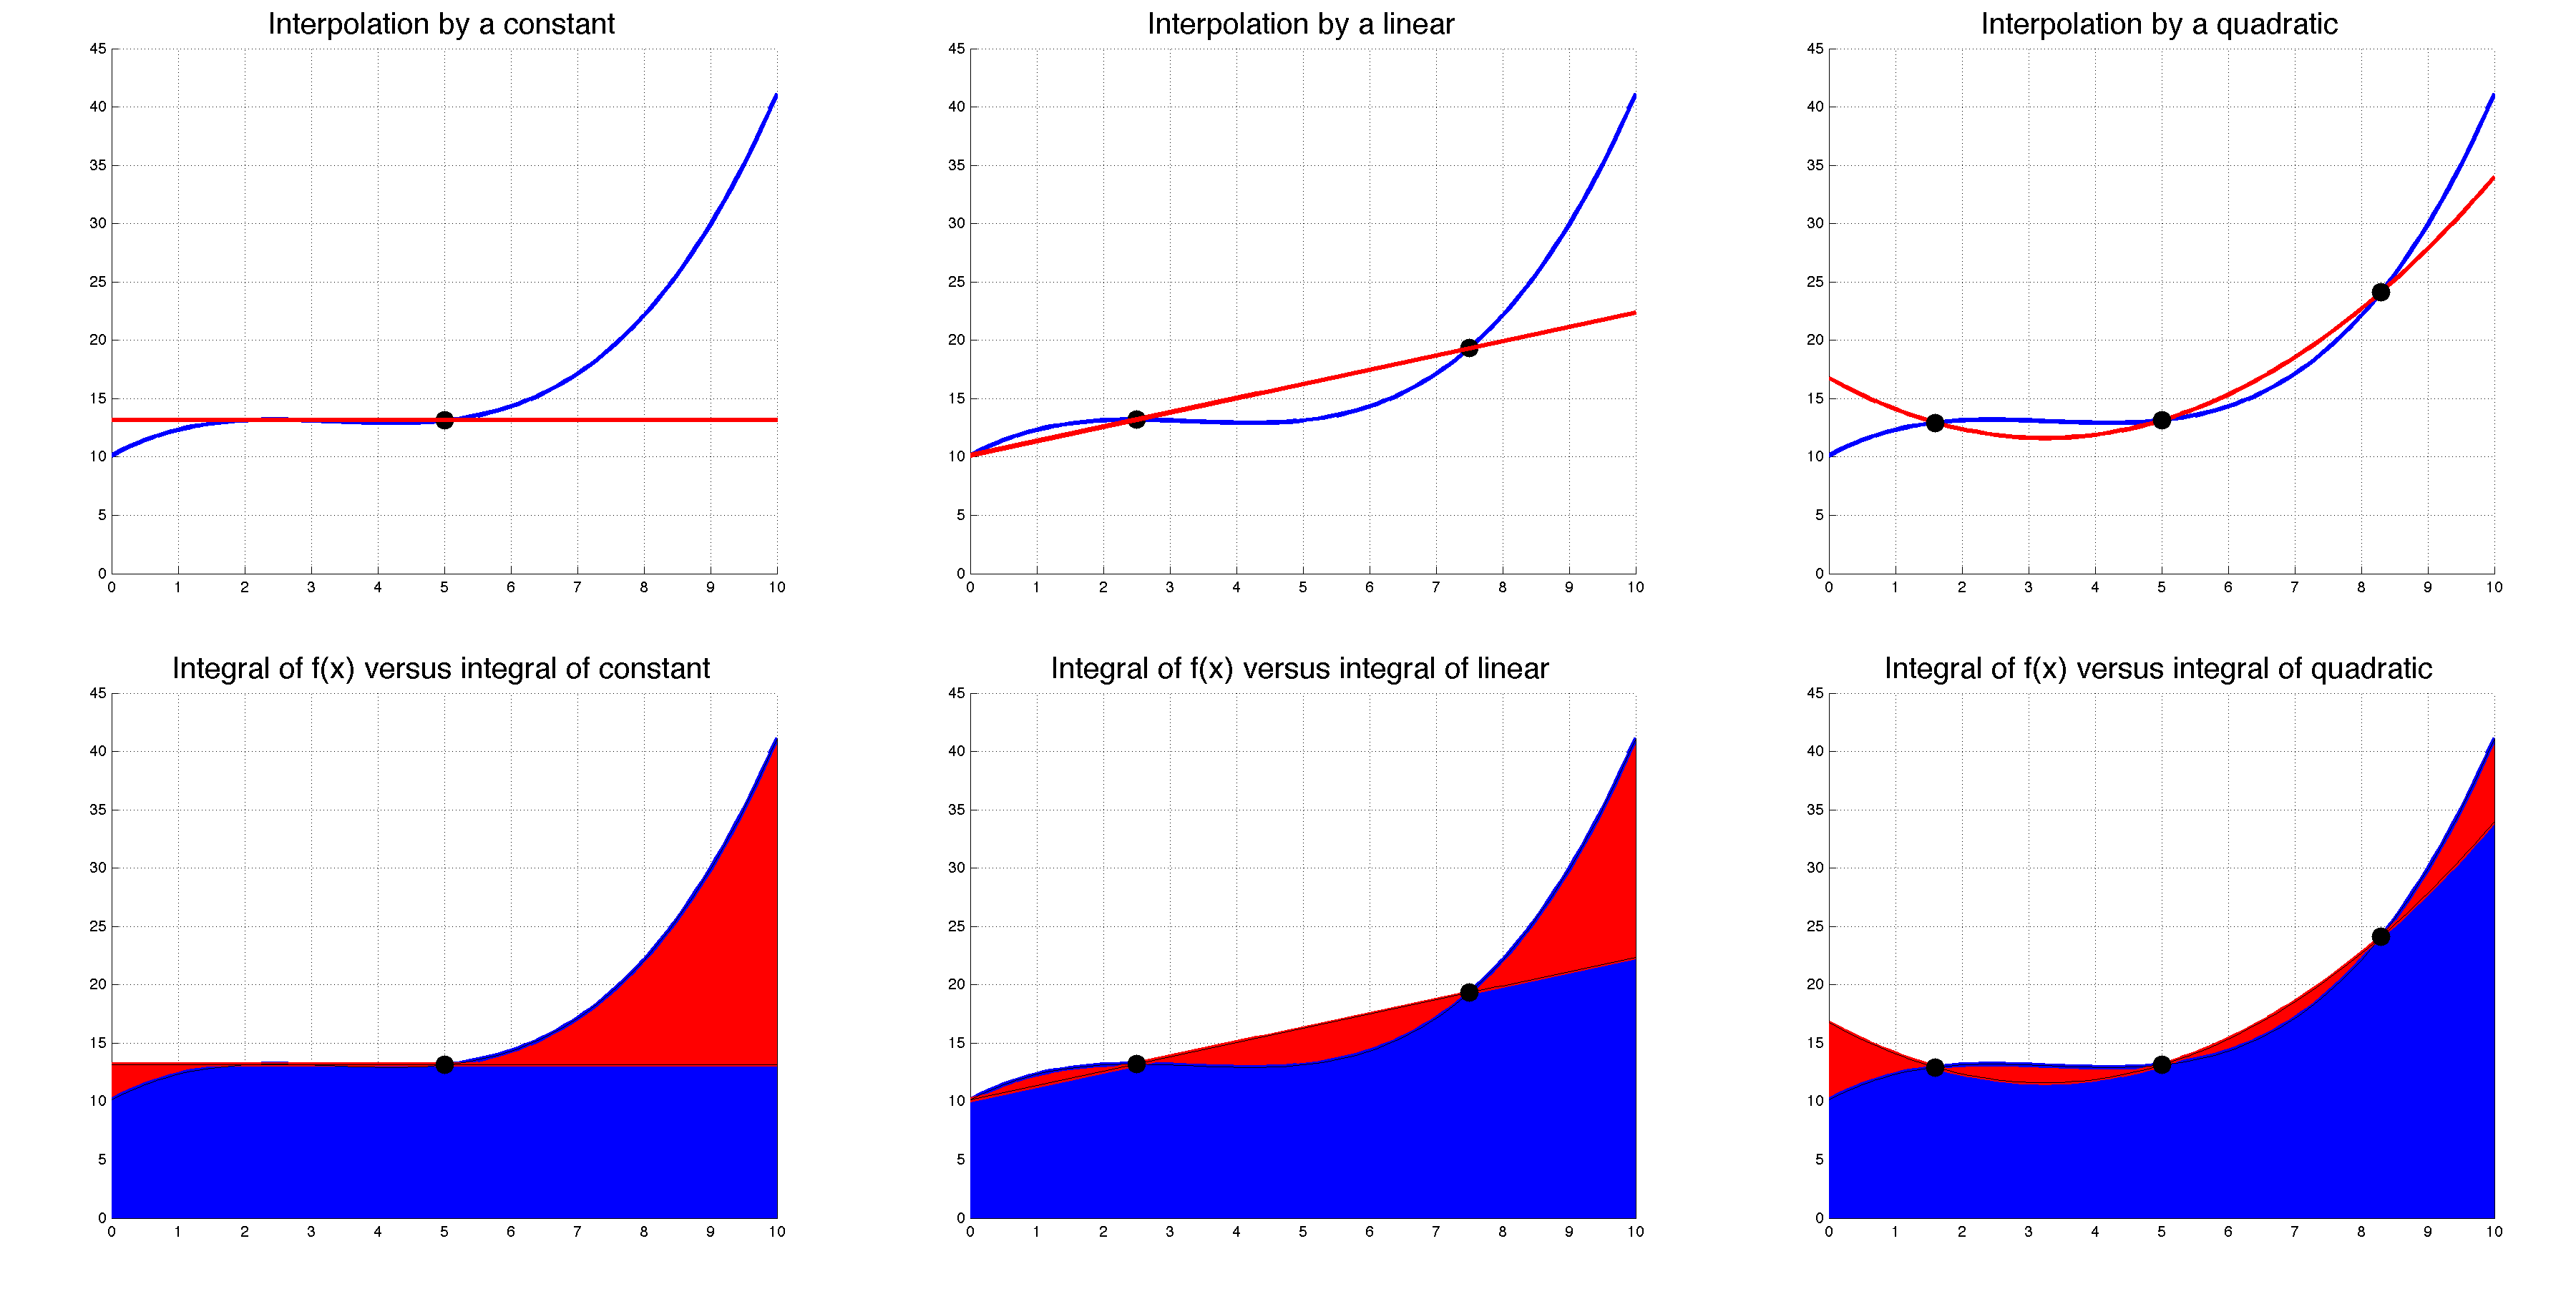
interp_six.png, six plots displaying constant, linear and quadratic
interpolants, and the quadrature error encountered when integrating each.
-
mydef.sty, a style file with some definitions.
-
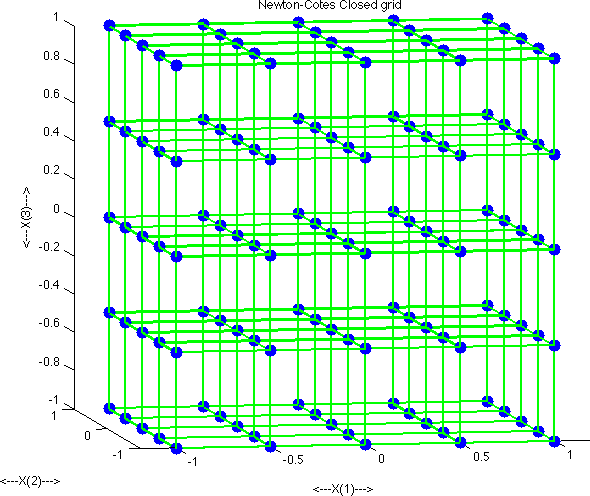
ncc_5x5x5.png, the abscissas for a 5x5x5 Newton-Cotes rule.
-
newdoe.png, a banner for the Department of Energy.
-
ornl_header.png, a banner for Oak Ridge National Laboratory.
-
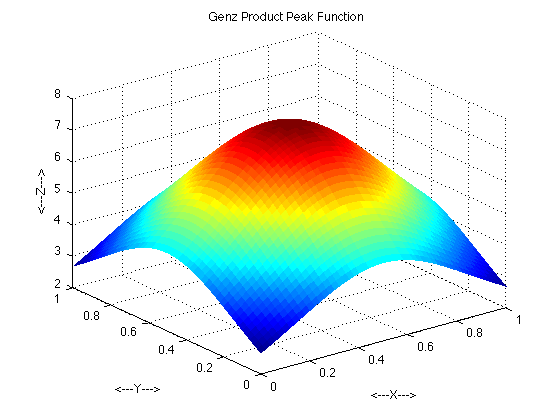
ppeak_plot.png,
a plot of a 2D version of the Genz product peak test function.
-
product_grids2.png,
the product grids used to construct a sparse grid.
-
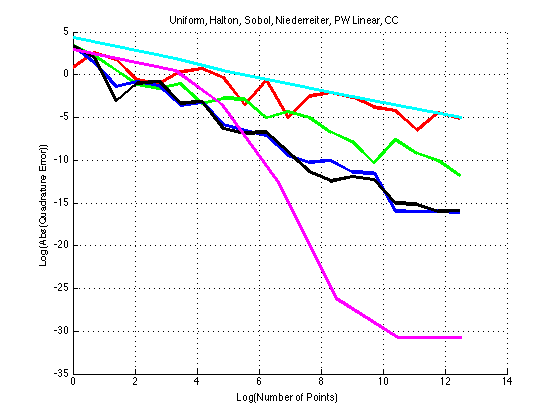
quadrature_error_cc.png,
the quadrature error made by various sampling approaches,
now including the Clenshaw Curtis product rule.
-
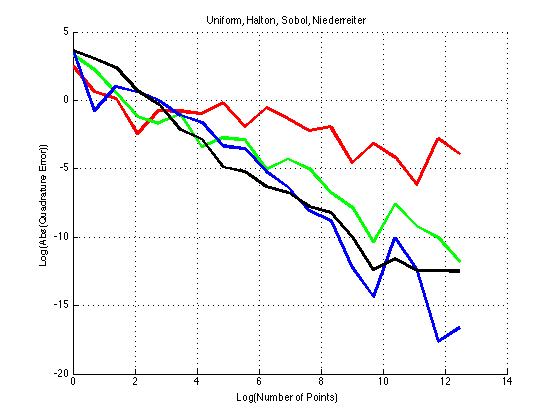
quadrature_error_sample.png,
the quadrature error made by various sampling approaches.
-
rgb_tex,
definitions of colors.
-
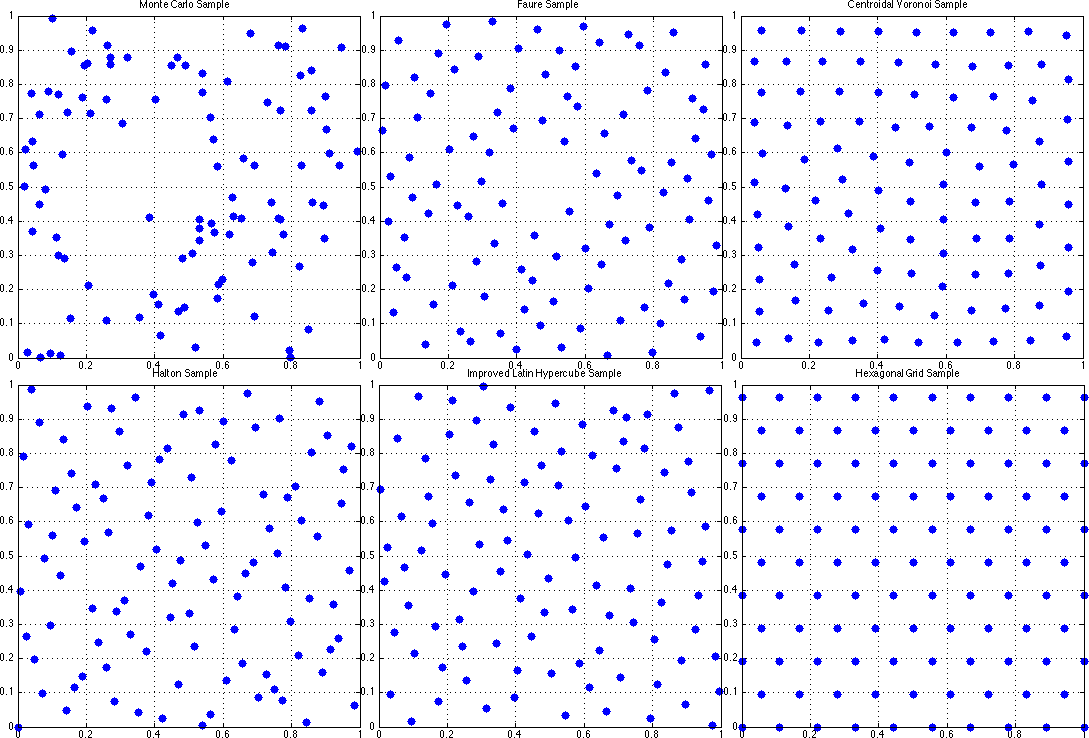
sample_points.png,
six plots suggesting ways of sampling the unit square.
-
siam_logo.pdf,
a logo for SIAM.
-
utbornl.png,
a logo for UT-Battelle.
Last revised on 06 February 2024.