datasets
datasets
data to be used for machine learning exercises.
-
admit_data.txt,
the English SAT score, the Math SAT score, and admit/not admit (1/0),
for 100 students applying to a particular college,
100x3 items
-
aircon_data.txt,
humidity, temperature and comfort (1/0),
44x3 items
-
album_data.txt,
sales of music albums, column 1 is year (2007-2017)
and column 2 is the number of sales (LP's, cassettes, CD's
and downloads),
11x2 items
-
ambulance_data.txt,
125x2 items
-
anscombe1_data.txt,
11x2 items
-
anscombe2_data.txt,
11x2 items
-
anscombe3_data.txt,
11x2 items
-
anscombe4_data.txt,
11x2 items
-
apples_and_oranges.csv,
There are three fields, weight (gm), size (cm), class (apple/orange).
header line plus
40x3 items
-
bankloan1_data.csv,
bank loan data #1, from Kelleher, MacNamee, D'Arcy.
There is an initial header line.
There are 10 records;
There are 5 fields: ID, Occupation, Age(years), Ratio, Outcome;
header line, plus
10x5 items
-
bankloan2_data.csv,
bank loan data #2, from Kelleher, MacNamee, D'Arcy.
There is an initial header line.
There are 25 records;
There are 9 fields: ID, Amount($), Salary($), Ratio, Age, Occupation,
Property, Type, Outcome;
header line, plus
25x9 items
-
basketball_data.csv,
basketball player data, from Kelleher, MacNamee, D'Arcy.
There are 30 records;
There are 5 fields: ID, Height(centimeters), Weight(pounds),
Sponsorship($), Age(years);
There is an initial header line, plus
30x5 items
-
basketball_data.txt,
basketball player data, from Kelleher, MacNamee, D'Arcy.
There are 30 records;
There are 5 fields: ID, Height(centimeters), Weight(pounds),
Sponsorship($), Age(years);
30x5 items
-
birthweight.csv,
id, headcircumference, length, Birthweight, gestation,
smoker, motherage, mother cigarettes, mother height, mother ppwt,
fage, fedyrs, father cigarettes, father height, lowbwt,
mage35, LowBirthWeight,
one header line, plus
42x17 items
-
blobs_centers.txt,
5x2 items, cluster centers
-
blobs_clusters.txt,
2020x1 items, assign each blob data item to a blob cluster center.
-
blobs_data.txt,
2020x2 items, data that forms 5 clusters
-
blobs_std.txt,
5x1 items, cluster standard deviations
-
bulgaria_population_data.txt,
column 1 is the year (1997-2018) and column 2 is the population,
29x2 items.
-
caesarian_data.txt,
80x6 items
-
card_data.csv,
Collection of 50 playing cards;
There is an initial header line.
There are 50 records;
There are 4 fields: Index, Rank(1-13), Suit(1-4), Order(1-52);
1 header line, plus
50x4 items
-
china_data.txt,
year and average income for China, 1952-2007.
12x2 items
-
climate_data.xls,
the data naturally forms two clusters.
1570x2 items.
-
corvette_data.txt,
the resale price for Corvettes by
model year. Each record lists the model year and asking price.
72x2 items
-
crash_data.csv,
computer crash reports.
There is an initial header line.
There are 20 records.
There are 5 fields: index(1-20), OS(1=Linux,2=OSX,3=Windows),
LANG (1=C,2=Python), Browser(1=Chrome,2=Explorer,3=Firefox,4=Safari),
Crash (0=No,1=Yes).
1 header line, plus
20x5 items
-
diabetes_data.csv,
1 header line, plus
768x9 items
-
draft_data.csv,
1 header line, plus
20x4 items
-
faith_data.txt,
eruption time (minutes), pause (minutes), height of geyser (feet),
50x3 items
-
faithful_data.csv,
Old Faithful geyser.
There are 272 records;
There are 3 fields: index, time between eruptions, and length of
eruption.
1 header line, plus
272x3 items
-
faithful_data.txt,
records 272 observations of eruptions of the Old
Faithful geyser, giving eruption length and eruption wait in minutes.
272x2 items
-
filip_data.txt,
is a dataset from the National Institute of Standards and
Technology (NIST), supplied by Albert Filippelli. 82 pairs of (x,y)
values are recorded. A 10th-degree polynomial fit y=p(x) is desired.
82x2 items
-
ford_data.csv,
the model year, mileage (miles), and selling price ($)
for 23 Ford Escorts. A linear fit is desired, to predict selling
price from mileage.
1 header line:
"Year","Mileage(thousands)","Price",
23x3 items
-
ford_data.txt,
the model year, mileage (miles), and selling price ($)
for 23 Ford Escorts. A linear fit is desired, to predict selling
price from mileage.
23x3 items
-
generator_data.txt,
56 records: index, rpm, vibration, fail(0)/active(1)
56x4 items
-
geyser_data.txt,
272x2 items
-
gold_data.txt,
observations of gold coins, some of which are counterfeit,
weight (grams), genuine (1 True, 0 False),
20x2 items
-
gopher_data.txt,
measurements of gophers from two species:
skull width (cm), skull length (cm), species (-1 or +1).
50x3 items
-
homes_data.txt,
records, for 49 houses that were sold recently, the selling price $,
asking price $, living area in square feet, # rooms, # bedrooms,
# bathrooms, age in years, lot size in acres, taxes $.
49x9 items
-
homes_test.txt,
3x9 items
-
hw_data.txt,
25000x3 items
-
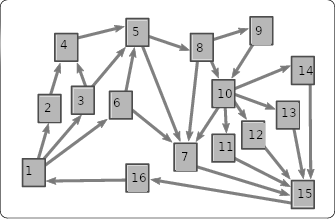
hyperlink_data.csv,
Hyperlink directed adjacency matrix for 16 web pages.
There are 16 records:
There are 16 fields: 0 or 1 if page i links to page j.
16x16 items
-
hyperlink_map.png,
a map of the hyperlinks.
-
insurance_data.csv,
Medical insurance costs;
There is an initial header line.
There are 1338 records:
There are 7 fields: age, sex, bmi, children, smoker, region, charges
1 header line, plus
1338x7 items
-
insurance_data.txt,
Medical insurance costs;
There is an initial header line.
There are 1338 records:
There are 7 fields: age, sex, bmi, children, smoker, region, charges
1338x7 items
-
insurance_test.txt,
61x7 items
-
insurance_train.txt,
1000x7 items
-
iris_data.csv,
150x5 items
-
iris_description.txt
-
jet_data.txt,
56 records: index, rpm, vibration, fail(-1)/working(1)
56x4 items
-
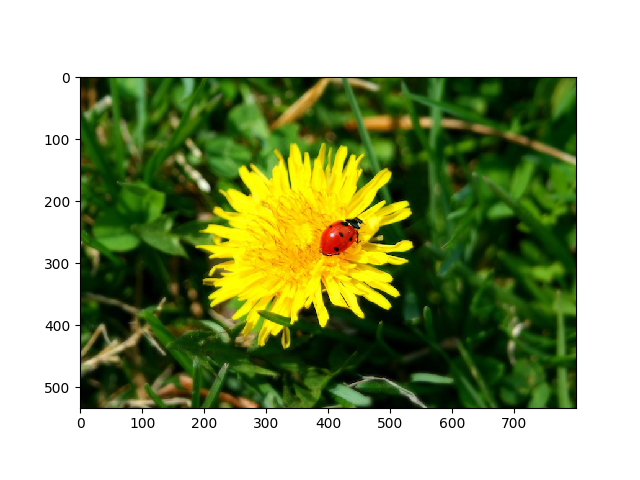
ladybug.png
-
loan_data.csv,
Data for a fraud-detection system.
There are 20 records.
There are 5 fields: ID(1-20), Credit History ("none", "paid", "current",
"arrears"), Guarantor ("none", "guarantor", "coapplicant" ),
Accommodation ("own", "rent", "free"), Fraud ("true", "false");
1 header line, plus
20x5 items
-
lump_data.txt,
11x8 items
-
medicine_hat_tigers_2007.txt,
1 header line,
25x8 items
-
mexico_population_data.txt,
column 1 is the year (1865-2018) and column 2 is the population,
13x2 items
-
mlb_data.txt,
records the 2018 winning percentage up to July 1, and
the team payroll, for the 15 American League teams:
Boston Red Sox, Los Angeles Angels, New York Yankees, Toronto Blue Jays,
Houston Astros, Seattle Mariners, Texas Rangers, Baltimore Orioles,
Detroit Tigers, Cleveland Indians, Kansas City Royals, Minnesota Twins,
Tampa Bay Rays, Oakland Athletics, Chicago White Sox.
15x2 items
-
playfair_data.txt,
Column 1 is the year, column 2 the price of a measure of wheat in
shillings, and column 3 is the average weekly earnings of a
mechanic in shillings.
The interesting item is the ratio of wheat price to earnings.
50x3 items
-
pollution_data.csv,
Various measurements related to air pollution in US cities.
There is an initial header line.
There are 41 records.
There are 8 fields: "City name", "SO2 mg/cm", "Average Temperature F",
"Manufacturing Plants", "1970 Population", "Average Wind Speed mph",
"Average Precipitation inches", "Annual Precipitation days"
1 header line, plus
41x8 items
-
price_data.csv,
is a table of average monthly prices for 11 consumer products,
between February 2008 and February 2018. There are 241 records. Each record
contains 13 items:
the month,
the year,
bananas (lb),
oranges (lb),
bread (lb),
tomatoes (lb),
chicken (lb),
electricity (kwh),
egss (dozen),
gasoline (gallon),
ground chuck (lb),
heating gas (therm),
milk (gallon).
1 header line, plus
241x13 items
-
price_data.txt,
is a table of average monthly prices for 11 consumer products,
between February 2008 and February 2018. There are 241 records. Each record
contains 13 items:
the month,
the year,
bananas (lb),
oranges (lb),
bread (lb),
tomatoes (lb),
chicken (lb),
electricity (kwh),
egss (dozen),
gasoline (gallon),
ground chuck (lb),
heating gas (therm),
milk (gallon).
241x13 items.
-
random_data.txt,
the (x,y) coordinates of 100 random points.
100x2 items.
-
rising_data.txt,
records 25 measurements of a physical experiment at
intervals of 1 second. A model of the form y(t) = c1 + c2 * t + c3 * sin(t)
is suggested.
This example is taken from "Numerical Methods and Software"
by Kahaner, Moler and Nash.
25x2 items.
-
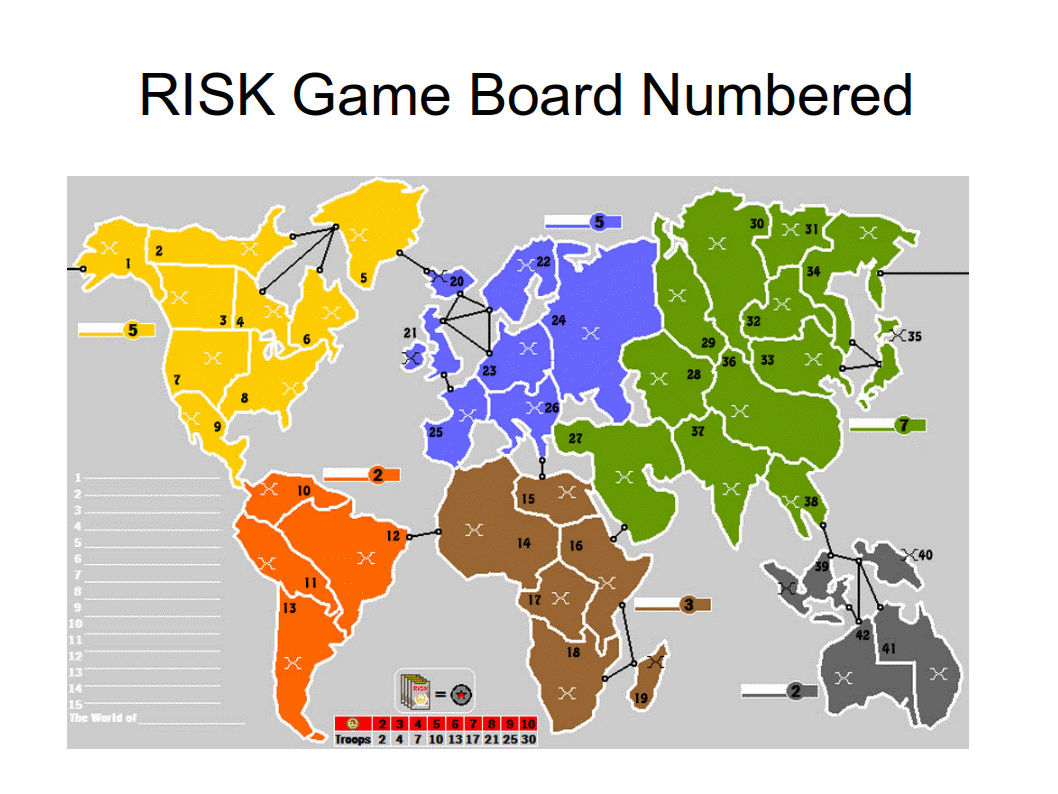
risk_data.csv,
Regional adjacency matrix for the game of Risk.
There are 42 records:
There are 42 fields of 0 or 1: adjacency to region 1,
region 2, ..., 42.
42x42 items.
-
risk_map.png,
A map that displays the names and numbers of the 42 Risk regions.
-
risk_names.csv,
Region names for the game of Risk.
Column 1 is the index, and column 2 is the region name.
There is one initial record.
42x2 items.
-
ruspini_data.txt,
a set of (x,y) coordinates which naturally form 4 clusters.
75x2 items.
-
schoolyear_data.csv,
the number of days in a school year, by country.
There is an initial header line.
There are 28 records.
There are 2 fields: Country name (a string), days in school year.
1 header line, plus
28x2 items
-
sex_age_height_weight_data.txt,
records sex (0=female,1=male), age (months),
height (inches), and weight (pounds) for 237 school children.
From Lewis and Taylor, 1967.
237x4 items
-
sine_test.txt,
100 pairs of (x,y) data in [0,1], column 1 is x, column 2 is sine(x).
This data should be used to test the model generated by
the sine_train.txt data.
100x2 items
-
sine_train.txt,
10 pairs of (x,y) data, column 1 is x, column 2 is sine(x),
to be used to construct a model function.
10x2 items
-
snowfall_data.txt,
a table of M = 132 rows and N = 10 columns.
Column 1 is the winter year
identifier, ranging from 1890-1891 to 2021-2022. Columns 2 through 9
are the snowfall in inches for October, November, December, January,
February, March, April and May. Column 10 is the total snowfall.
These measurements were taken near Michigan Tech.
132x10 items
-
spring_data.txt,
records the results of Hooke's law experiments, in which
a spring is loaded with a given weight M, and the resulting
deflection D is measured. A linear relationship D=c*M is expected.
There are 20 records, with two fields, mass in kilograms, and
deflection in meters. From Guttag, 2016.
20x2 items.
-
strain_data.txt,
10x2 items
-
titanic.pdf
-
titanic_test.csv,
1 header line, plus
1308x11 items.
-
titanic_train.csv,
1 header line, plus
891x12 items
-
titanium_data.txt,
is a dataset from Carl DeBoor's "A Practical Guide to Splines".
49 pairs of (x,y) values are recorded, which represent the variation
of some property of titanium.
49x2 items
-
turtle_data.csv,
contains 54 records of turtle measurements.
Each record lists the index, sex (-1=M,+1=F), length of carapace,
width of carapace, and height (the measurement of
the carapace plus the plastron).
1 header line, plus
54x6 items
-
two_temperatures_data.txt,
Fahrenheit and Celsius temperatures of freezing and boiling,
2x2 items
-
us_population_data.txt,
column 1 is the year (1900-2020) and column 2 is the population,
121x2 items
-
volcano_data.txt,
is based on a rectangular grid of 87 X coordinates
and 61 Y coordinates. At each grid point (X(I),Y(J)), the value
Z(I,J) stores the height of a volcano. There are 87 records in the
file, one for each X value. Each record contains 61 values of Z,
one for each Y value.
87x61 items
-
weather_data.txt,
temperature, pressure, humidity and wind speed, for
June 26, 27, 28, and 29,
5x4 items
-
weight_data.txt,
sex (0/1), September weight (kg), April weight (kg),
September BMI, April BMI.
67x5 items
-
wine_data.csv,
no header line,
178x14 items
-
wine_header.txt,
the header information for the wine data, as a separate file,
14x1 items
Last revised on 13 February 2022.