TASK: Create a contour plot of a function that represents a "valley".
COMMENT: Consider the function
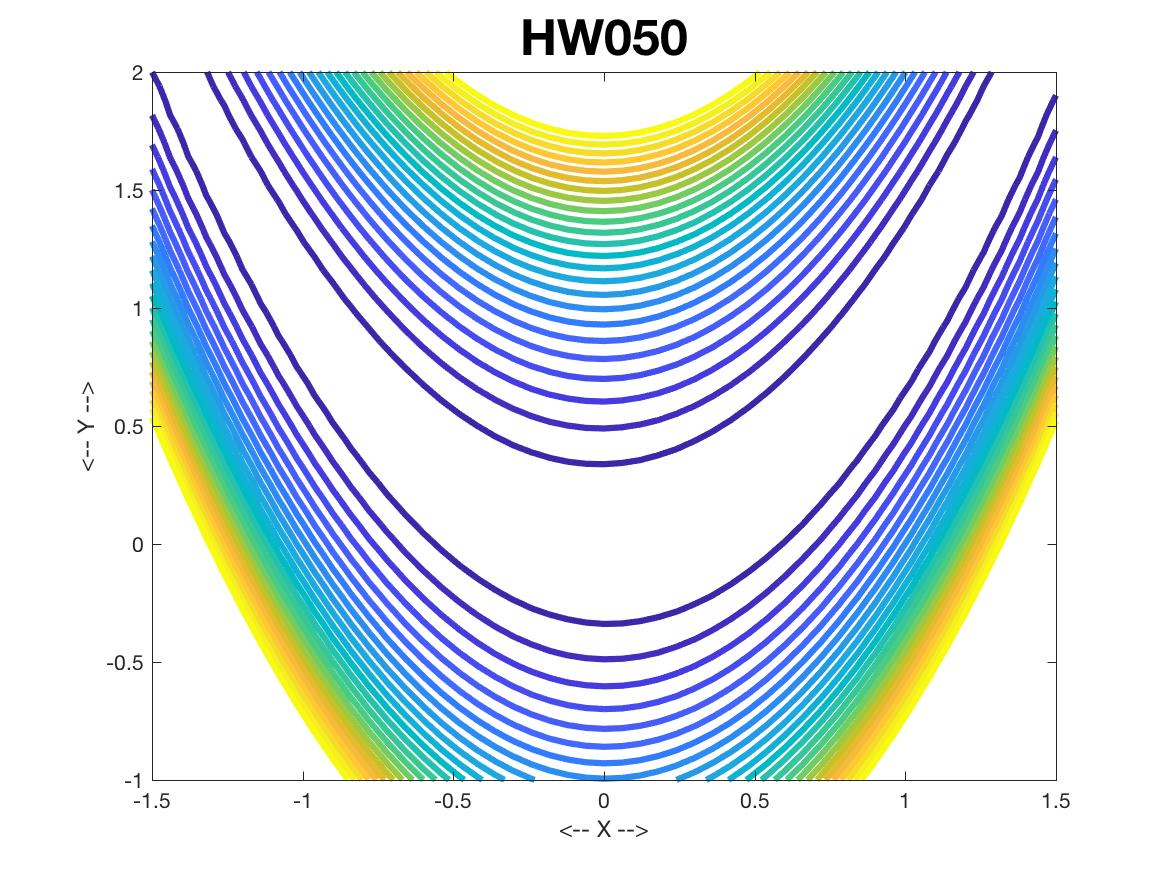
f(x,y) = ( 1 - x )^2 + 100 * ( y - x^2 )^2
An important task in computing is to look for the minimum value
of functions, and this f(x,y) is a typical example. It helps
to have a map of the area you are exploring, and so we want to
make a contour map of the function over a small rectangular region.
INSTRUCTIONS:
        xvec = go between -1.5 and 1.5
        yvec = go between -1.0 and 2.0
        [ X, Y ] = make tables from xvec and yvec
        Z = evaluate the function

        cvec = choose about 20 or 30 values between 0 and 300
        call contour, including the "cvec" information

        function Z = ...include function f in your script
          Z = ?
          return
        end
CHECK:
You might get something like this:
SUBMIT: Your script file should be named "hw050.m", and begin with:
        % hw050.m
        % YOUR NAME
        % This script (describe what it does)
I do not need a copy of your plot.