TASK: Make a plot of 24 data values.
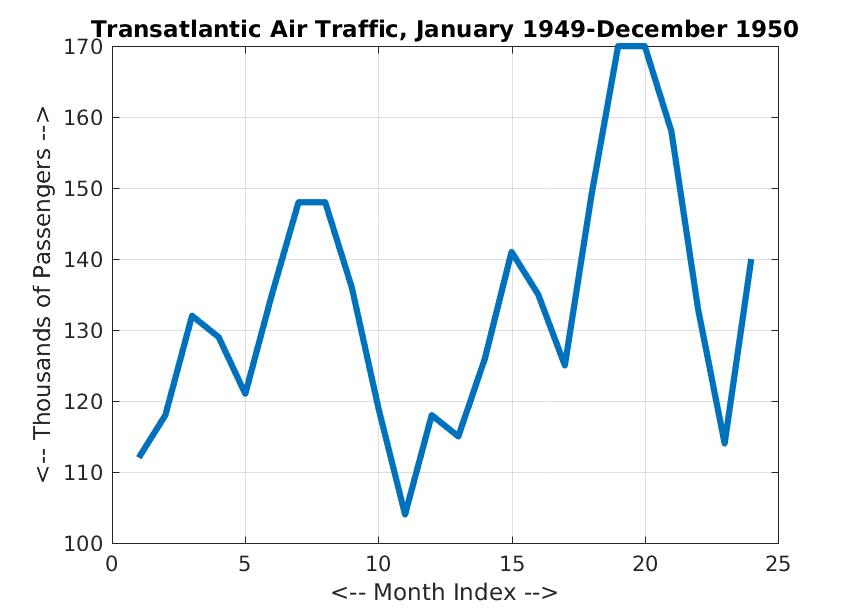
COMMENT: The number of transatlantic air travelers was counted for each month from January 1949 to December 1950. The values, in thousands, were: 112, 118, 132, 129, 121, 135, 148, 148, 136, 119, 104, 118, 115, 126, 141, 135, 125, 149, 170, 170, 158, 133, 114, 140.
We want to make a plot of these values. The X axis will simply be a month counter, that goes from 1 to 24. The Y axis will be the air traveler count, that is, the list of data.
INSTRUCTIONS:
        Create an xlist that contains the numbers 1 through 24.   There are
        at least three ways to do this.  Choose one:
        1) make a list of values by putting every number inside a pair
           of square brackets: xlist = [1, 2, ?, ?, ... ],
        2) or use "colon" notation: xlist = ?:?;
        3) or use linspace: xlist = linspace ( ?, ?, ? );

        Create a ylist by copying the data above, inside a pair of square brackets.

        Use a plot(?,?) command to create the plot.

        Once you see the plot, use a more complicated plot(?,?,?,?) command so
        the LineWidth used is 3;

        Follow your plot statement by commands that
        1) turn on grid lines;
        2) label the X axis;
        3) label the Y axis.
        4) title the plot.

        Your last command should save a copy of your plot:

        print ( '-djpeg', 'hw033.jpg' );
CHECK:
SUBMIT: I only need your script file "hw033.m". I do NOT need your plot file. Your script file should begin with:
        % hw033.m
        % YOUR NAME
        % This script (describe what it does)