matplotlib
Mathematical Programming with Python
https://people.sc.fsu.edu/~jburkardt/classes/...
python_2025/matplotlib/matplotlib.html
matplotlib:
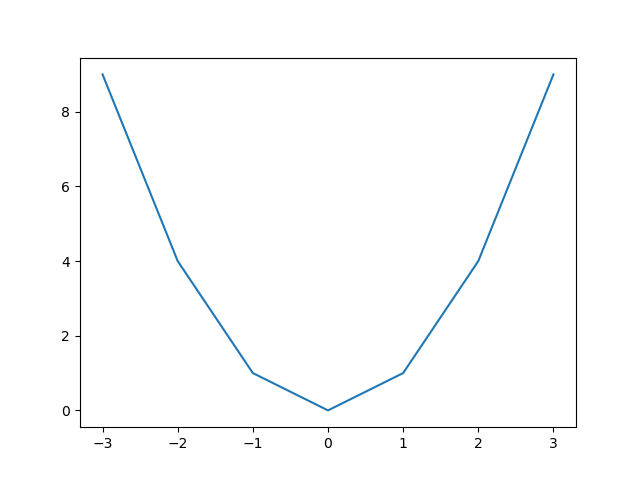
the matlotlib() library makes plots of functions, data, shapes,
bar graphs and histograms. Many of the commands are similar to what
is used in MATLAB graphics. Plots can be customized with line
width and color, with titles, grids, and legends.
Lecture notes:
-
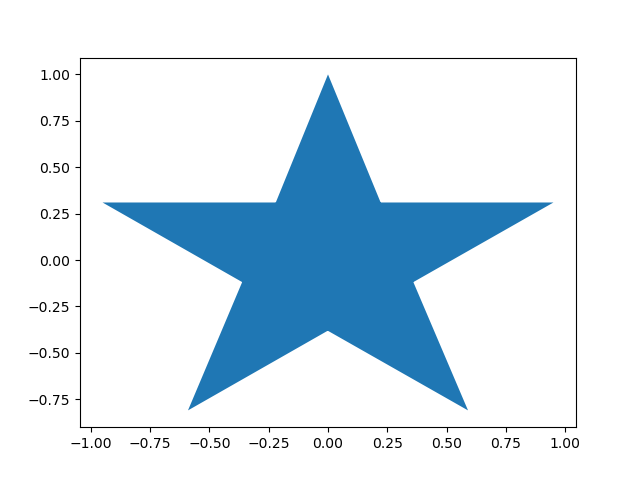
star_fill.py,
appends a copy of first point to the end of the data,
and fills the resulting star polygon with color.
-
star_fill.png
Last revised on 03 February 2025.