test_interp
test_interp,
a Python code which
defines data that may be used to test interpolation algorithms.
The following sets of data are available:
-
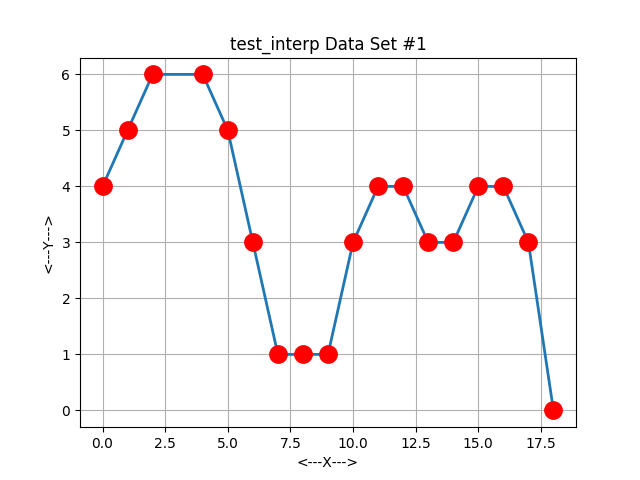
p01_plot.png,
18 data points, 2 dimensions.
This example is due to Hans-Joerg Wenz.
It is an example of good data, which is dense enough in areas
where the expected curvature of the interpolant is large.
Good results can be expected with almost any reasonable
interpolation method.
-
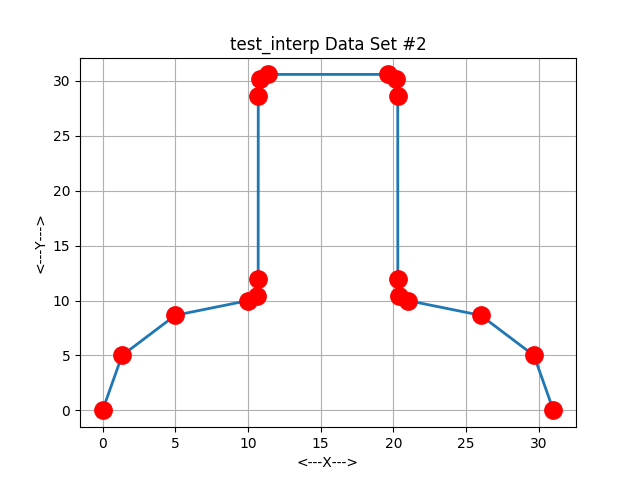
p02_plot.png,
18 data points, 2 dimensions.
This example is due to ETY Lee of Boeing.
Data near the corners is more dense than in regions of small curvature.
A local interpolation method will produce a more plausible
interpolant than a nonlocal interpolation method, such as
cubic splines.
-
p03_plot.png,
11 data points, 2 dimensions.
This example is due to Fred Fritsch and Ralph Carlson.
This data can cause problems for interpolation methods.
There are sudden changes in direction, and at the same time,
sparsely-placed data. This can cause an interpolant to overshoot
the data in a way that seems implausible.
-
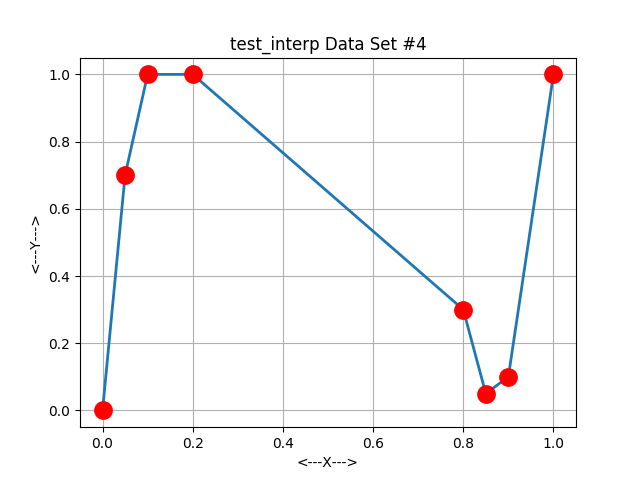
p04_plot.png,
8 data points, 2 dimensions.
This example is due to Larry Irvine, Samuel Marin and Philip Smith.
This data can cause problems for interpolation methods.
There are sudden changes in direction, and at the same time,
sparsely-placed data. This can cause an interpolant to overshoot
the data in a way that seems implausible.
-
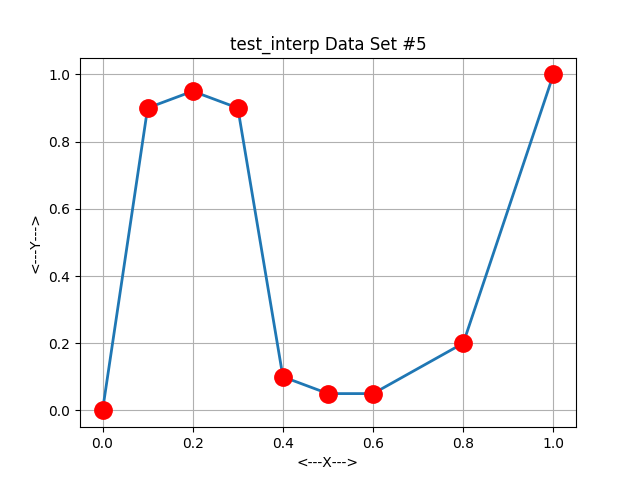
p05_plot.png,
9 data points, 2 dimensions.
This example is due to Larry Irvine, Samuel Marin and Philip Smith.
This data can cause problems for interpolation methods.
There are sudden changes in direction, and at the same time,
sparsely-placed data. This can cause an interpolant to overshoot
the data in a way that seems implausible.
-
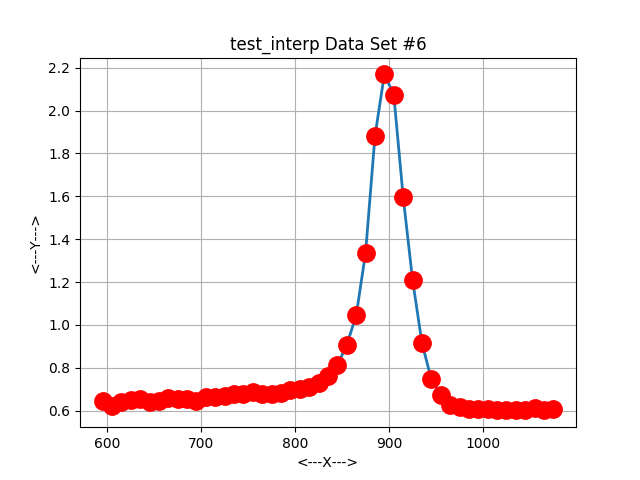
p06_plot.png,
49 data points, 2 dimensions.
The data is due to deBoor and Rice.
The data represents a temperature dependent property of titanium.
The data has been used extensively as an example in spline
approximation with variably-spaced knots.
DeBoor considers two sets of knots:
(595,675,755,835,915,995,1075)
and
(595,725,850,910,975,1040,1075).
-
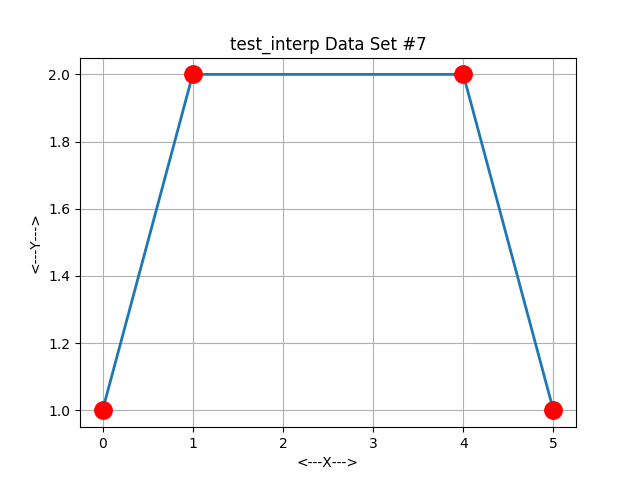
p07_plot.png,
4 data points, 2 dimensions.
The data is a simple symmetric set of 4 points,
for which it is interesting to develop the Shepard interpolants
for varying values of the exponent p.
-
p08_plot.png,
12 data points, 2 dimensions.
This is equally spaced data for y = x^2,
except for one extra point whose x value is close to another, but whose
y value is not so close. A small disagreement in nearby data can
become a disaster.
Licensing:
The computer code and data files described and made available on this web page
are distributed under
the MIT license
Languages:
test_interp is available in
a C version and
a C++ version and
a FORTRAN90 version and
a MATLAB version and
a Python version.
Related Data and Programs:
BARYCENTRIC_INTERP_1D,
a Python code which
defines and evaluates the barycentric Lagrange polynomial p(x)
which interpolates a set of data, so that p(x(i)) = y(i).
The barycentric approach means that very high degree polynomials can
safely be used.
LAGRANGE_INTERP_1D,
a Python code which
defines and evaluates the Lagrange polynomial p(x)
which interpolates a set of data, so that p(x(i)) = y(i).
NEAREST_INTERP_1D,
a Python code which
interpolates a set of data using a piecewise constant interpolant
defined by the nearest neighbor criterion.
NEWTON_INTERP_1D,
a Python code which
finds a polynomial interpolant to data using Newton divided differences.
PWL_INTERP_1D,
a Python code which
interpolates a set of data using a piecewise linear function.
SHEPARD_INTERP_1D,
a Python code which
defines and evaluates Shepard interpolants to 1D data,
based on inverse distance weighting.
TEST_INTERP_1D,
a Python code which
defines test problems for interpolation of data y(x),
depending on a 2D argument.
VANDERMONDE_INTERP_1D,
a Python code which
finds a polynomial interpolant to data y(x) of a 1D argument, by
setting up and solving a linear system for the polynomial coefficients,
involving the Vandermonde matrix.
Source Code:
Plots of piecewise linear interpolants to the data:
Last revised on 27 July 2017.