fem2d_scalar_display_test, a MATLAB code which calls fem2d_scalar_display(), which reads datafiles describing a set of nodes, their triangulation, and the value of a scalar quantity at each node, and creates a graphics file of the corresponding surface plot, which is then displayed using the MATLAB graphics system.
The computer code and data files described and made available on this web page are distributed under the MIT license
fem2d_scalar_display, a MATLAB code which reads information about nodes, elements and nodal values for a 2D finite element method (FEM) and creates a surface plot of U(X,Y), using the MATLAB graphics system.
ELL is an L-shaped region on which the function U=X^2+Y^2 is defined.
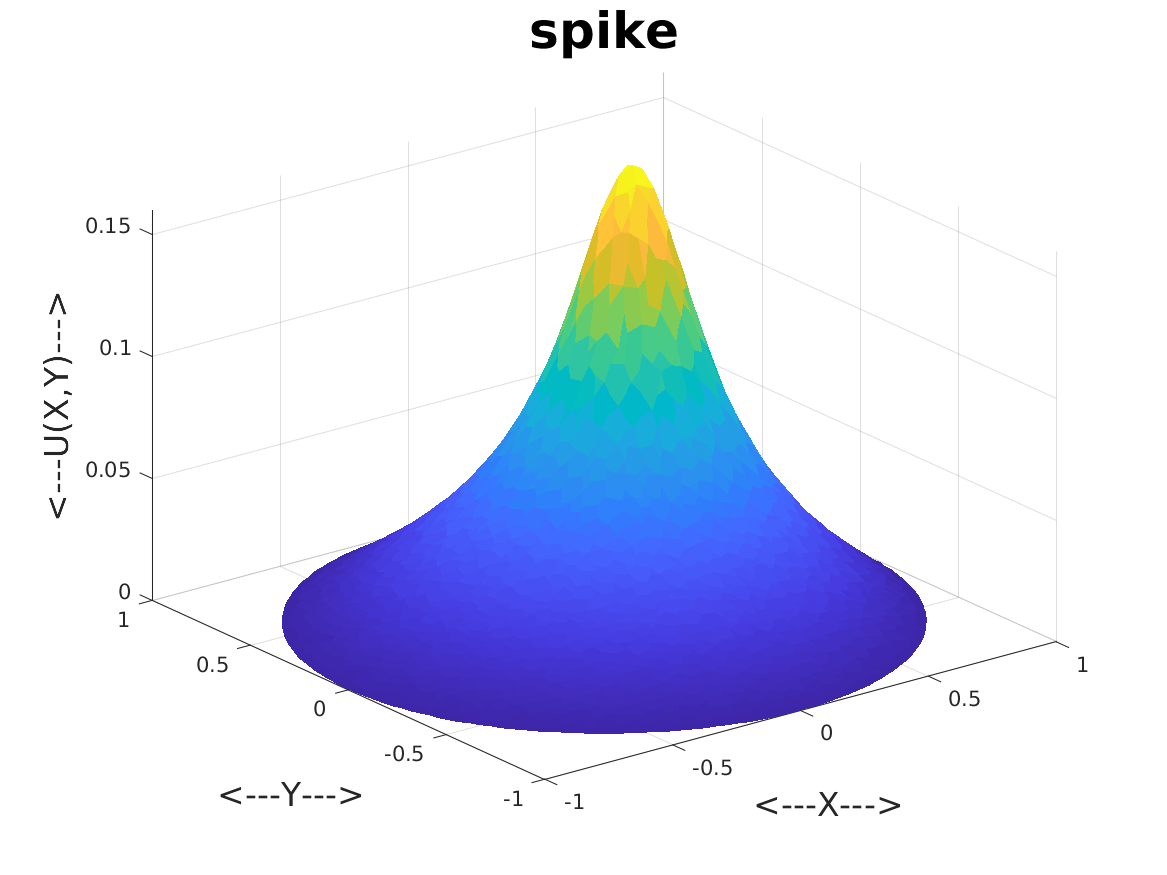
SPIKE is a circular region on which a solution of the Poisson equation forms an off-centered spike.