As part of a collaboration with the Studio for Creative Inquiry, biomedical and graphics specialists at the Pittsburgh Supercomputing Center are developing an animation of data derived from fMRI brain scan data.
The original data can be thought of as 124 sheets of X-ray film, with each sheet containing 256 by 256 squares, each square containing a number representing some kind of density. The squares are 0.9375 millimeters on a side, and the sheets are spaced 1.5 millimeters apart, with the first sheet essentially picking up the left ear, subsequent sheets proceeding sideways through the head until they reach the right ear.
With this raw data, it is easy to reconstruct a three dimensional image of the brain. However, it's just a picture, without any structure. It's of great interest to be able to say "this blob here is the medulla oblongata", for instance. But to do that, the numbers in the data set have to be associated with particular brain structures. The original numerical data was transformed into a "tagged" set of data, so that it was now possible to display, for instance, any particular piece or structure of interest.
If we just "turn on" all the chunks that have, say, label 17, we'd actually get an ugly angular mass of blocks that doesn't look at all realistic. In fact, a great deal of work has to go into estimating where the real boundary is, and representing it as a smoothly varying surface.
Even then, the work isn't done. I won't go into details, but I'll just mention that Greg Hood and I spent a good part of two days trying to get the brain (which was one set of data) and the head (which was another set of data) to match up. Each time we picked a new angle or scale factor, we had to reprocess all the data and wait five or ten minutes (if we were on the fast computer) before we'd see the results.
As a "preview" of the animation, here is a picture that shows the lobes of the cerebrum and the cerebellum in transparent pink, and the optic system and visual cortex in red. The head is suggested by the translucent white surround.

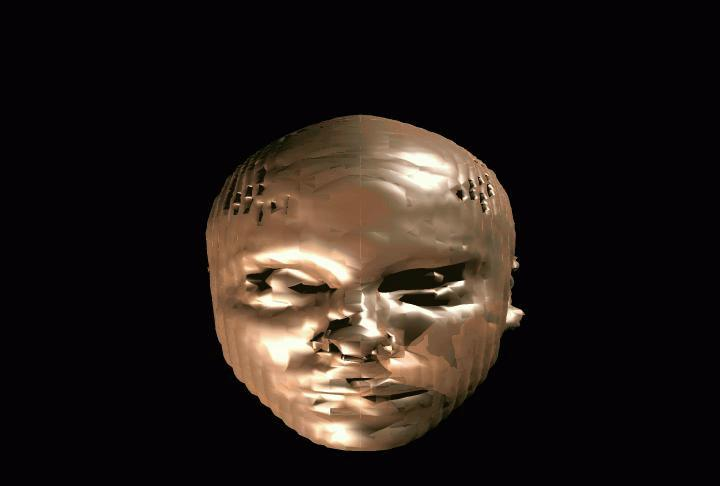
The data for the head doesn't look too bad in the previous picture, because it's translucent. Unfortunately, if you focus on the head, you can see how crude some of the information is! Not many people know what their visual cortex looks like, but everybody can spot a goofy head!.

As another part of the animation, Greg wanted to create a simulation of what it would be like to be in the middle of the visual cortex. He wanted to display a realistic and reasonably accurate display of the tangled forest of neuron connections. Since he wanted to "grow" the neurons at random, I worked with him on algorithms for picking a random direction in space. Other algorithms I wrote helped him to build a block of neurons and then repeatedly use the same block to fill up the screen image.
You can see an MPEG version of this animation, titled Moving Through the Visual Cortex".