stats, a dataset directory which contains example datasets used for statistical analysis.
The computer code and data files described and made available on this web page are distributed under the GNU LGPL license.
CENSUS, a dataset directory which contains US census data;
DRAFT_LOTTERY, a dataset directory which contains the numbers assigned to each birthday, for the Selective Service System lotteries for 1970 through 1976.
HARTIGAN, a dataset directory which contains datasets for testing clustering algorithms;
ISWR, a dataset directory which contains datasets used for statistical analysis.
MARTINEZ, a dataset directory which contains datasets for computational statistics, including cluster analysis;
MDS, a dataset directory which contains datasets for M-dimensional scaling;
PCL, a dataset directory which contains datasets from a gene expression experiment on Arabidopsis, which are candidates for data cluster analysis;
REGRESSION, a dataset directory which contains datasets for testing linear regression;
SGB, a dataset directory which contains files used as input data for demonstrations and tests of Donald Knuth's Stanford Graph Base.
SOKAL_ROHLF, a dataset directory which contains biological datasets considered by Sokal and Rohlf.
SPAETH, a dataset directory which contains datasets for cluster analysis;
SPAETH2, a dataset directory which contains datasets for cluster analysis;
TIME_SERIES, a data directory of examples of time series, which are simply records of the values of some quantity at a sequence of times.
TRIOLA, a dataset directory which contains datasets used for statistical analysis.
WORDS, a dataset directory which contains lists of words;
Files with an extension of .txt are "text" files; the columns of data are separated by spaces.
Files with an extension of .csv are "comma separated value" files; the columns of data are separated by commas. These files often have an initial "header" line containing a label for each column. Each label is generally delimited by quotation marks.
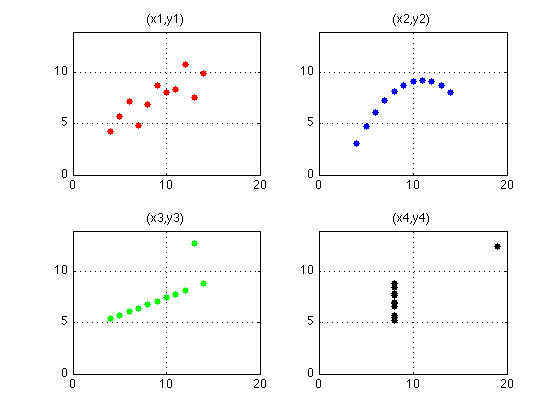
anscombe contains four sets of 11 pairs of (x,y) data. Sets (x1,y1), (x2,y2), (x3,y3) and (x4,y4) all have the same average x, average y, the same regression line: y = 3 + 0.5 * x, the same variance, the same correlation coefficient, and the same value of r^2. And yet these datasets, when plotted, are obviously quite different.
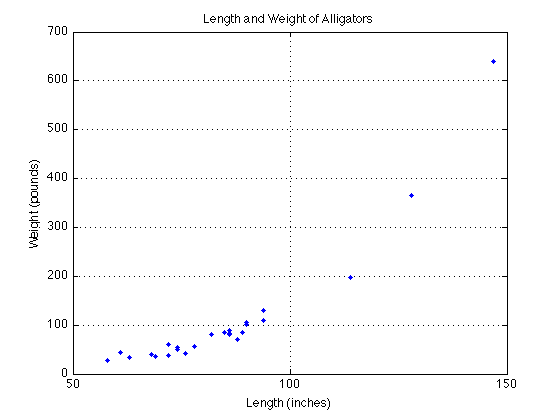
alligators contains weight (in pounds) and length (in inches) of 26 alligators sampled in central Florida.
asteroids contains records about a number of asteroids, including the index, name, mass in kg, density in g/cm^3, and three radial dimensions. This information is extracted from data presented as part of Jim Baer's program CODES (Comet/asteroid Orbit Determination and Ephemeris Software).
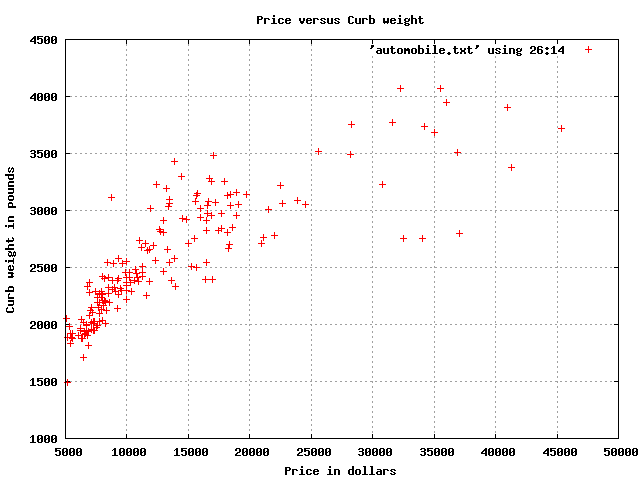
automobile contains 205 records, with 26 attributes, describing properties of cars available in 1985, taken from the UCI Machine Learning Repository. Some data values are missing, and are indicated by '?'. The data is comma separated, and includes text, integers, and real values. Our interest is to make a scatter plot of certain pairs of real attributes.
basketball records information about a fictitious basketball team
ben_stiller records the title, year, and US Gross of 53 movies in which Ben Stiller had a role.
brad_pitt records the title, year and US Gross of 40 movies in which Brad Pitt had a role.
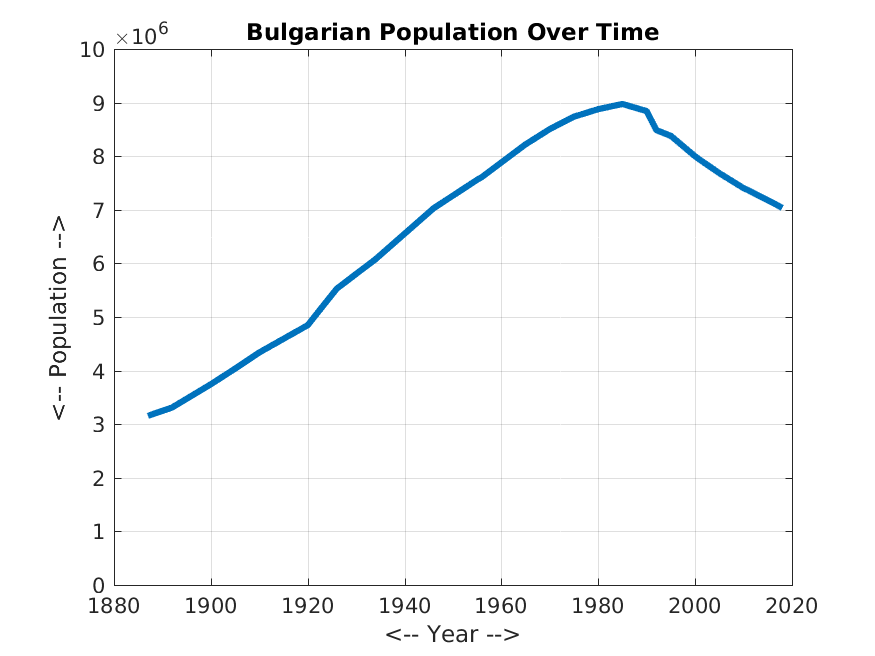
bulgaria contains the year and Bulgarian population count.
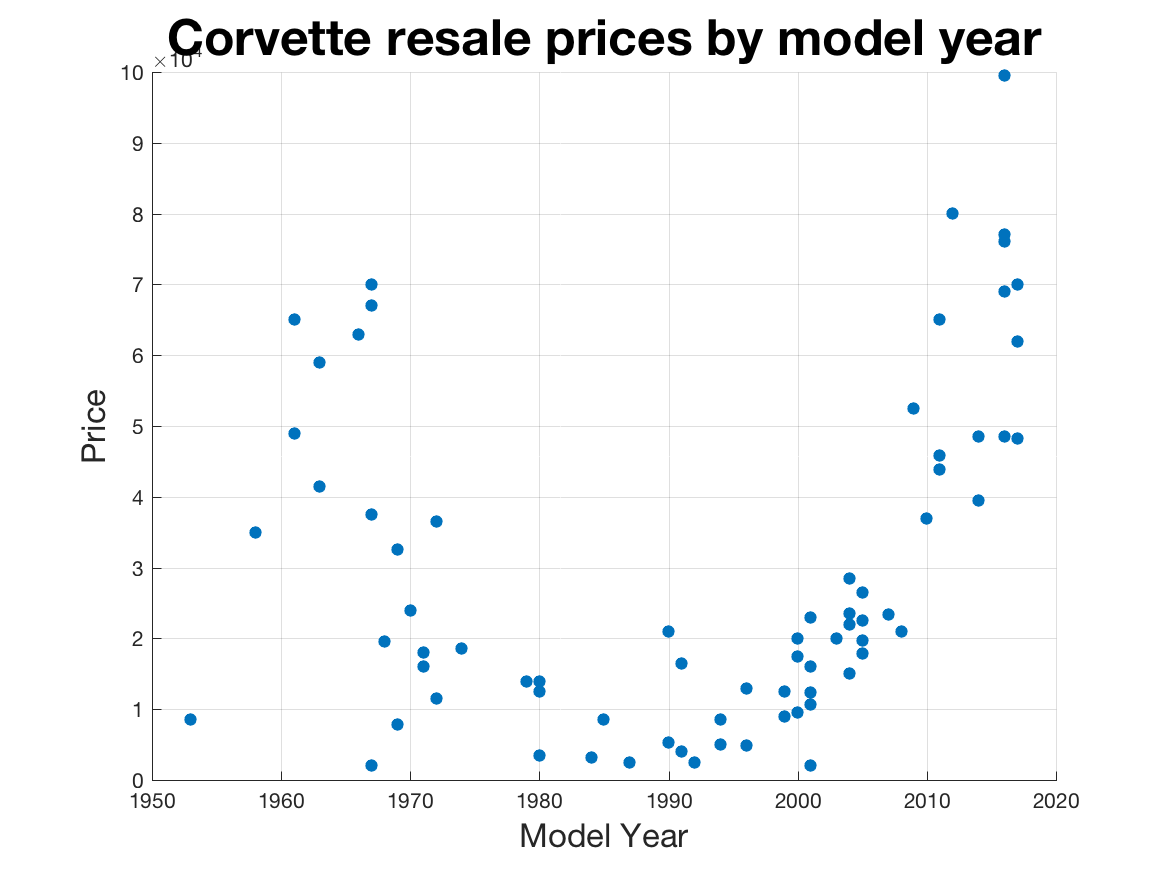
corvette records the resale price for Corvettes by model year.
cricket_data records temperature in degrees Fahrenheit, and number of cricket chirps per 15 second interval.
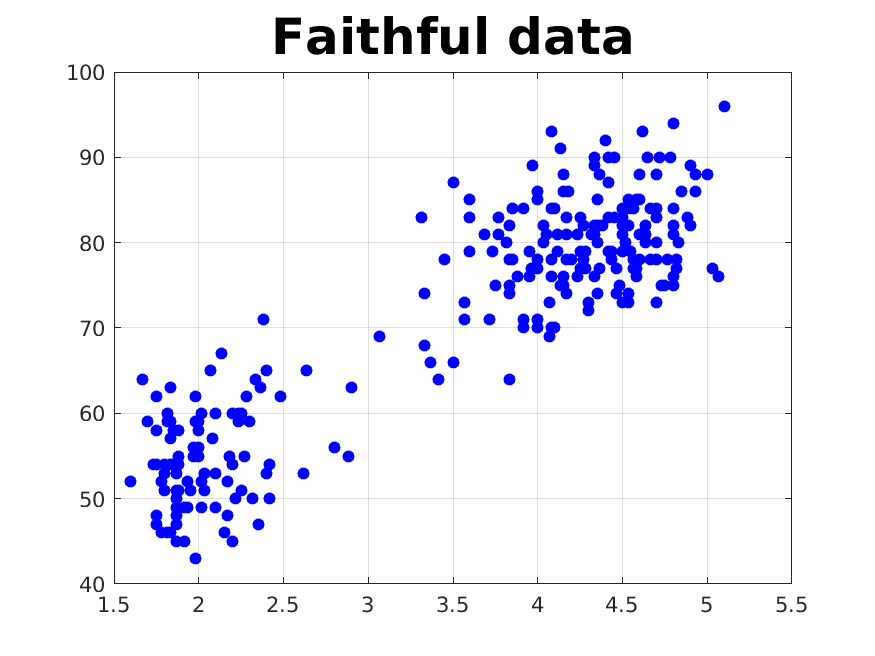
faithful_data records 272 observations of eruptions of the Old Faithful geyser, recording eruption length and eruption wait in minutes.
filip_data is a dataset from the National Institute of Standards and Technology (NIST), supplied by Albert Filippelli. 82 pairs of (x,y) values are recorded. A 10th-degree polynomial fit y=p(x) is desired.
ford_data records the model year, mileage (miles), and selling price ($) for 23 Ford Escorts. A linear fit is desired, to predict selling price from mileage.
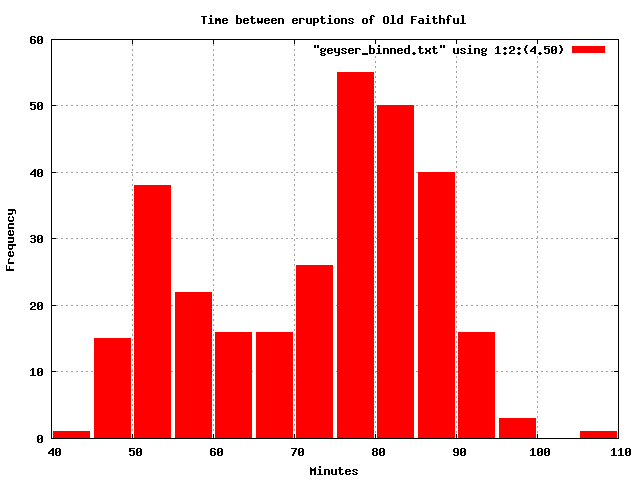
geyser_data contains the waiting time in minutes between successive eruptions of the Old Faithful geyser. 299 values are recorded. The data ranges from 43 to 108. The data comes from Martinez and Martinez.
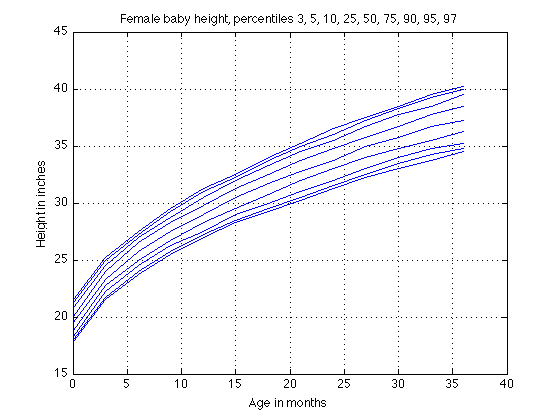
height_female_baby records the height in inches of female babies, measured every three months from 0 to 36 months, for the 3rd, 5th, 10th, 25th, 50th, 75th, 90th, 95th and 97th percentiles, taken from the 2000 CDC Growth Charts.
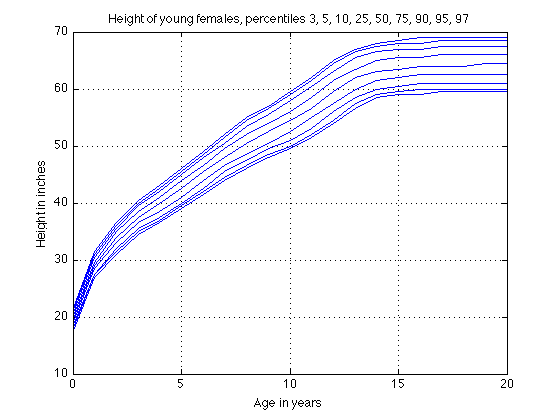
height_female_young records the height in inches of young females, measured every year from 0 to 20 years, for the 3rd, 5th, 10th, 25th, 50th, 75th, 90th, 95th and 97th percentiles, taken from the 2000 CDC Growth Charts.
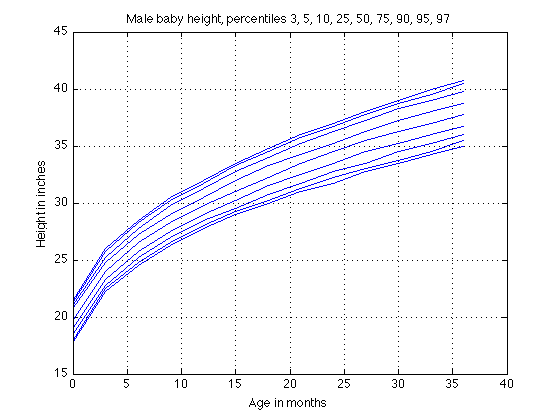
height_male_baby records the height in inches of male babies, measured every three months from 0 to 36 months, for the 3rd, 5th, 10th, 25th, 50th, 75th, 90th, 95th and 97th percentiles, taken from the 2000 CDC Growth Charts.
height_male_young records the height in inches of young males, measured every year from 0 to 20 years, for the 3rd, 5th, 10th, 25th, 50th, 75th, 90th, 95th and 97th percentiles, taken from the 2000 CDC Growth Charts.
homes records, for 50 houses that were sold recently, the selling price $, asking price $, living area in square feet, # rooms, # bedrooms, # bathrooms, age in years, lot size in acres, taxes $.
lead_shot records measurements for 25 grades of lead shot, including the grade, weight in ounces and grams, diameter in inches and millimeters, and the rough number of pellets per ounce.
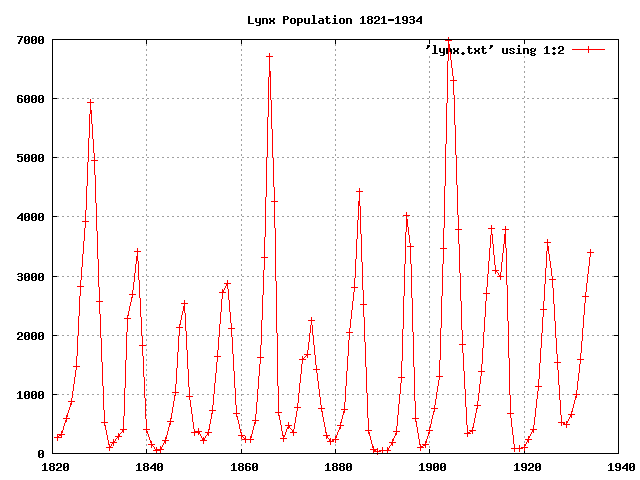
lynx records the yearly lynx harvest from 1821 to 1934.
mars records measurements of the x-coordinate of Mars in a heliocentric coordinate system at intervals of 10 days. There are 10 records. Each record lists the date (a numeric value), and the observed x-coordinate. This data comes from Conte and deBoor, "Elementary Numerical Analysis".
measles_nyc is a table of two columns. Column 1 lists months from January 1, 1928 to November 1, 1963, as decimal values. Column 2 lists the number of measles cases reported over that month.
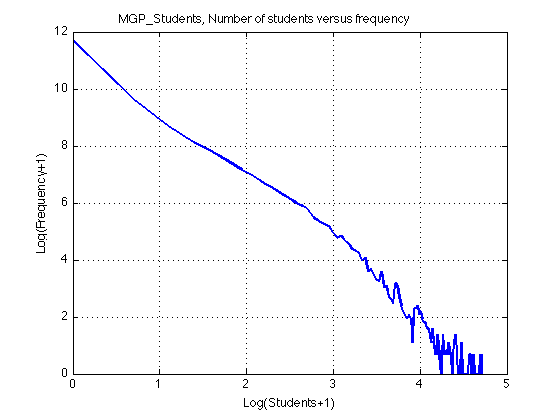
mgp_students records the frequency with which a person listed in the Math Genealogy Project web site has the given number of students. The data was extracted on 15 January 2012, and the number of students ranges from 0 to 110.
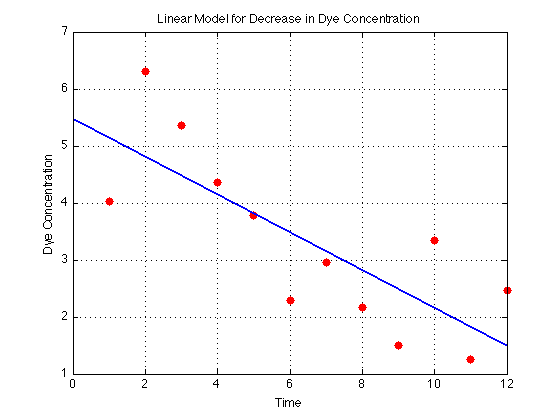
mixing records the concentration of dye in a stream of water leaving a container, over time. It is expected that this concentration will decrease approximately linearly over time. This example is taken from "Numerical Methods and Software" by Kahaner, Moler and Nash.
mlb_payroll records the 2018 winning percentage up to July 1, and the team payroll, for the 15 American League teams: Boston Red Sox, Los Angeles Angels, New York Yankees, Toronto Blue Jays, Houston Astros, Seattle Mariners, Texas Rangers, Baltimore Orioles, Detroit Tigers, Cleveland Indians, Kansas City Royals, Minnesota Twins, Tampa Bay Rays, Oakland Athletics, Chicago White Sox.
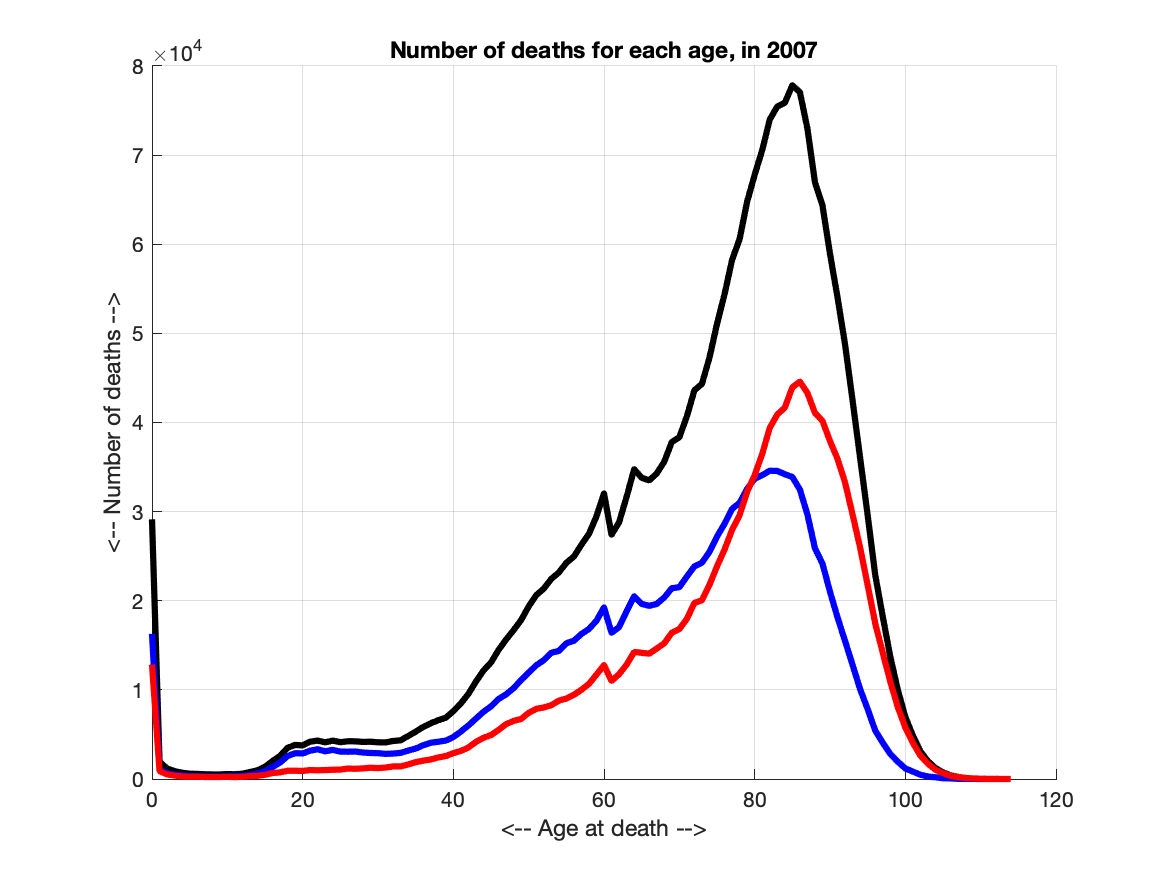
mortality contains total, male, and female mortality totals for the United States, by age from 0 to 114, for the year 2007. Fields are age, total mortality, male mortality, female mortality.
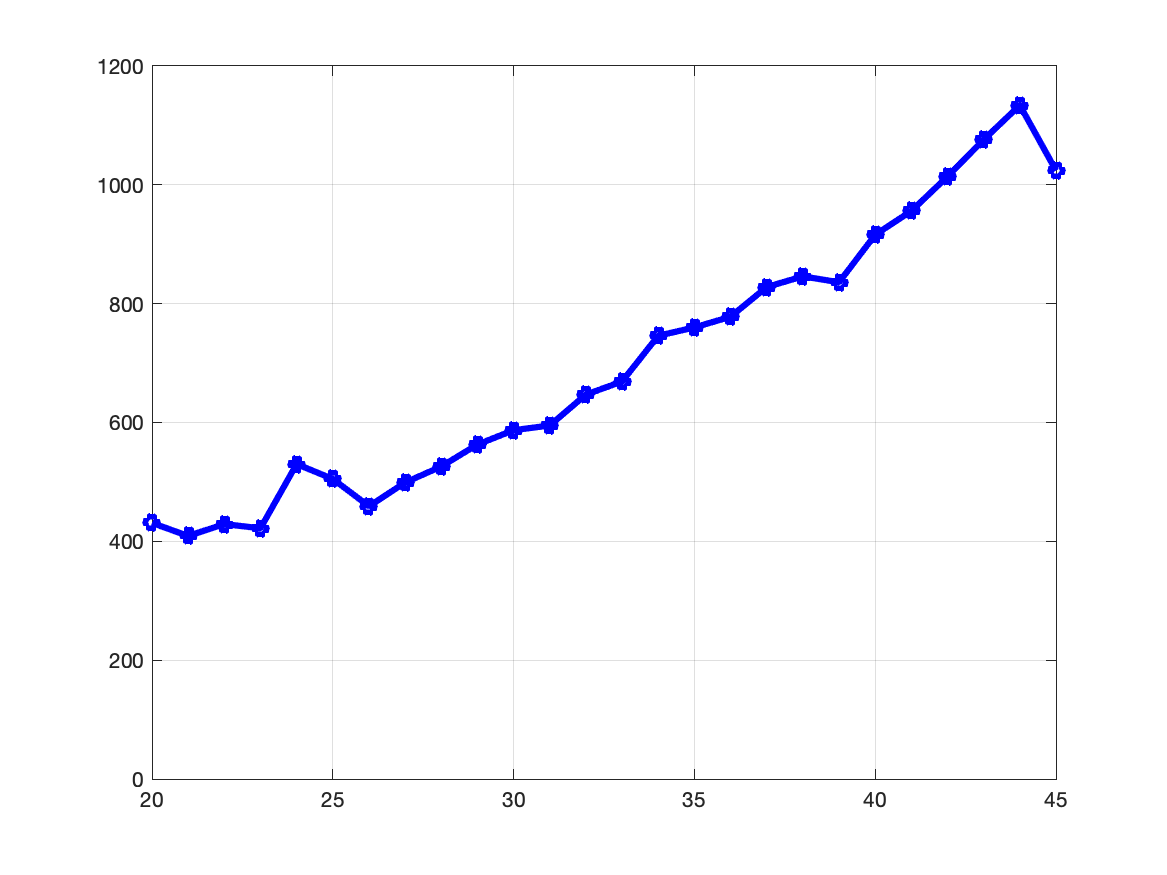
mortality2 contains mortality rates per 100,000 for England around the year 1900, over the age range 20-45. It is suggested that the data could be approximated by three lines, with domains [20,28], [28,39] and [39,45]. This example is taken from "Numerical Methods and Software" by Kahaner, Moler and Nash.
movie_budgets records the budgets for 3,546 movies made in recent years. Information includes rank, title, release date, distributor, budget, US gross sales, and worldwide gross sales.
movies records the money made by movies during a given year, including movies released in previous years. Information includes rank, title, release date, distributor, genre, MPAA rating, gross sales, tickets sold, gross adjusted for inflation. The information was obtained from "THE NUMBERS" website: http://www.the-numbers.com.
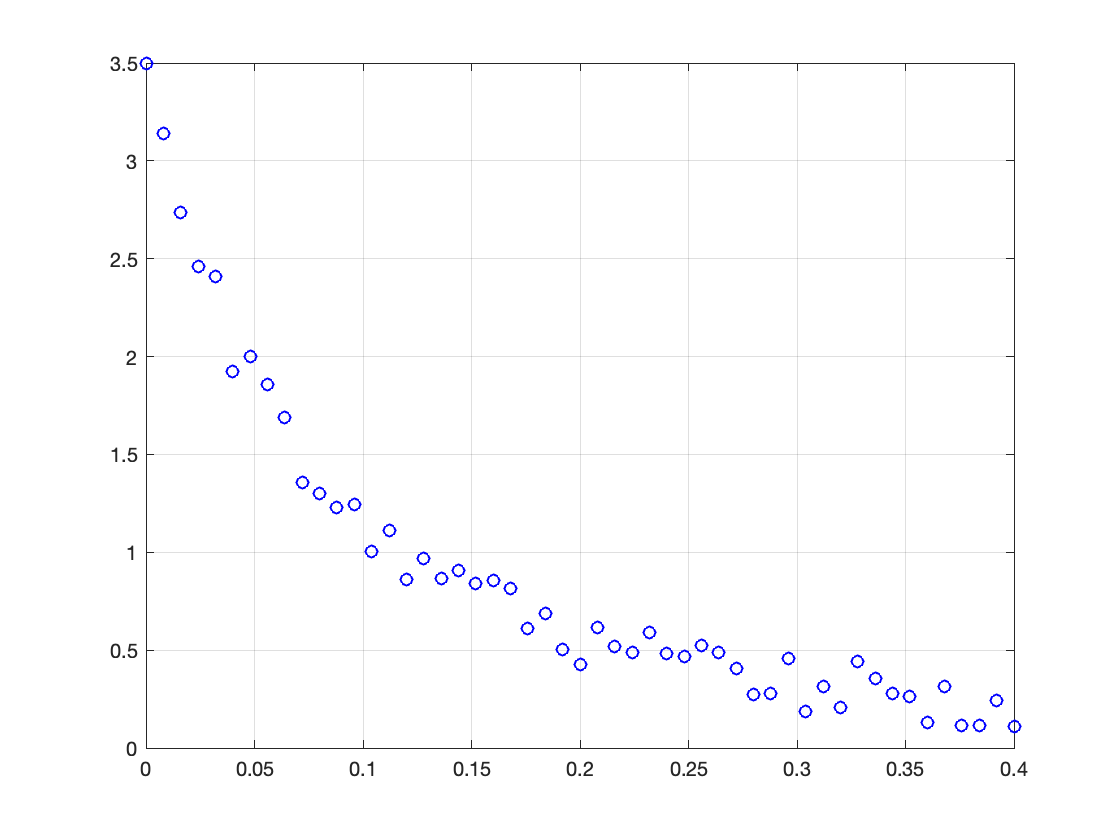
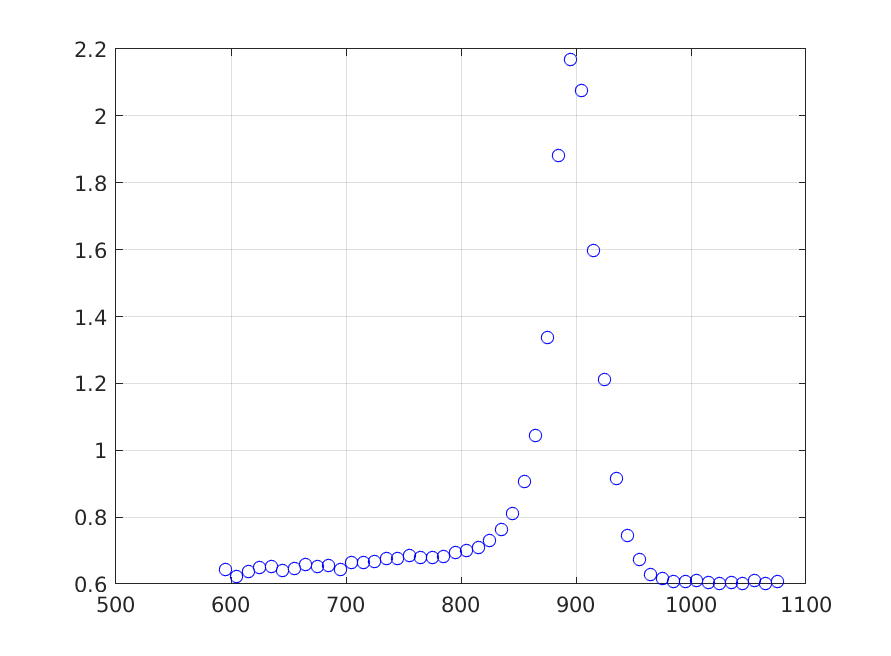
nmr records values of a nuclear magnetic resonance (NMR) time signal involving frozen cod, for which the model is phi(t)=c1*exp(-lambda1*t)+c2*exp(-lambda2*t), with assumed values lambda1=27 and lambda2 = 8. The amplitudes c1 and c2 are proportional to the amount of water in two proton environments. The data contains 51 records of t and phi(t), for equally spaced times between 0 and 0.4 seconds. It is desired to estimate the parameters, which are c1 = 1.27 and c2 = 2.04.
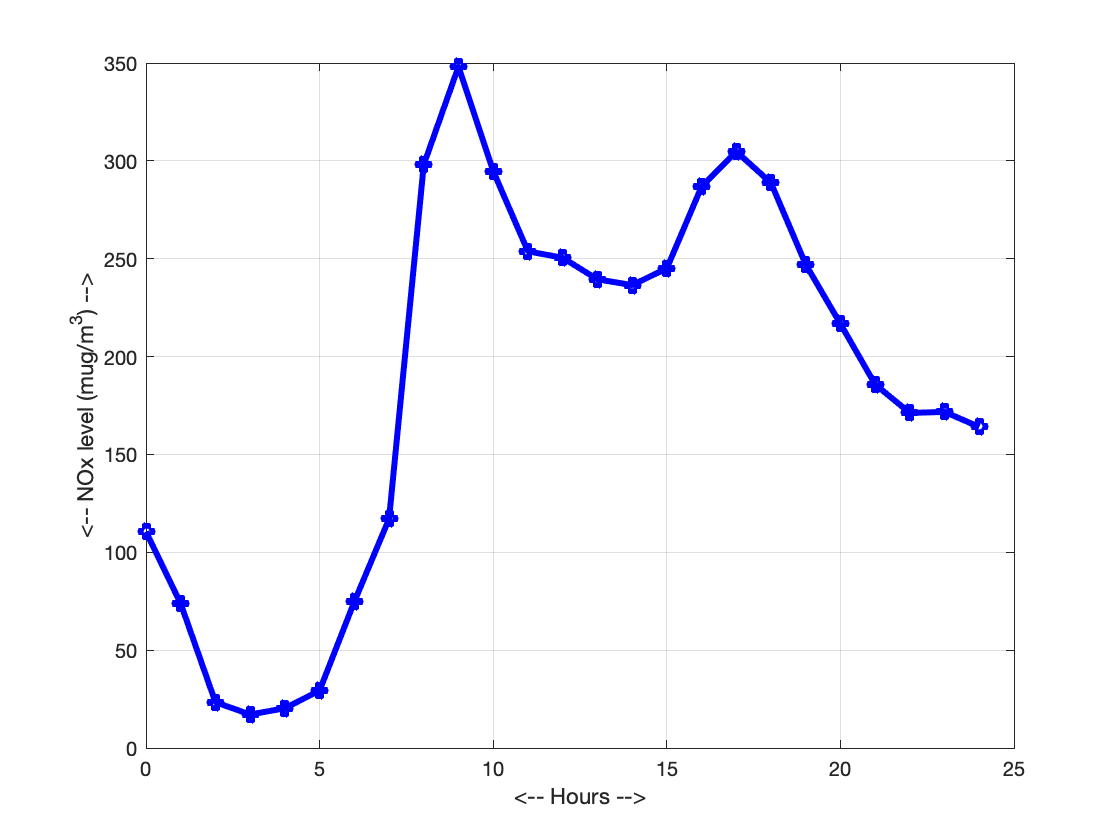
nox records measurements of nitric oxide at a monitoring location in a city. Hourly measurements were recorded over one day, with NO measurements in micrograms per cubic meter.
presidential_heights contains the name of each president, his height measured in inches, and a rating of greatness (0 = failure, 1 = below average, 2 = average, 3 = above average, 4 = near great, 5 = great, NA = not available. The data is from the article by Paul Sommers.
price_data is a table of average monthly prices for 11 consumer products, between February 2008 and February 2018. There are 241 records. Each record contains 13 items: the month, the year, bananas (lb), oranges (lb), bread (lb), tomatoes (lb), chicken (lb), electricity (kwh), egss (dozen), gasoline (gallon), ground chuck (lb), heating gas (therm), milk (gallon).
republicans_2012 records, for each of five Republican candidates for president, the percentage of responses that were favorable, unfavorable, no opinion, or "Who?", for Republican, Democratic, Independent and Total voters.
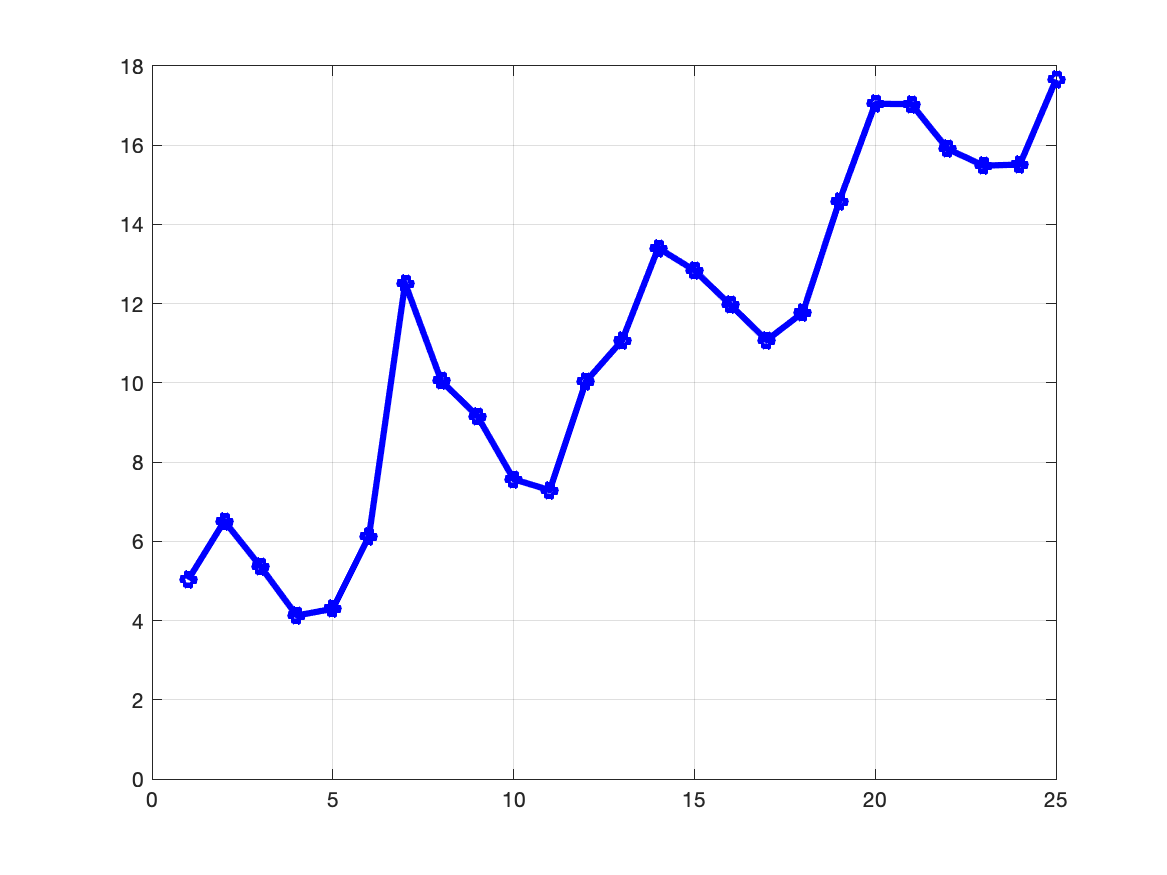
rising records 25 measurements of a physical experiment at intervals of 1 second. A model of the form y(t) = c1 + c2 * t + c3 * sin(t) is suggested. This example is taken from "Numerical Methods and Software" by Kahaner, Moler and Nash.
sat_by_state records average SAT (Scholastic Aptitute Test) scores per state, including population, average verbal and math scores, percentage of eligible students taking the exam, percentage of adult population without a high school education, and annual teacher pay in thousands of dollars.
sex_age_height_weight records sex (0=female,1=male), age (months), height (inches), and weight (pounds) for a group of school children. From Lewis and Taylor, 1967.
sine records uniformly spaced samples of the "noisy" function y=sin(2*pi*x)+0.1*randn(), where randn() is a normally distributed random value, and x ranges uniformly from 0 to 1.
spring records the results of Hooke's law experiments, in which a spring is loaded with a given weight M, and the resulting deflection D is measured. A linear relationship D=c*M is expected. There are 20 records, with two fields, mass in kilograms, and deflection in meters. From Guttag, 2016.
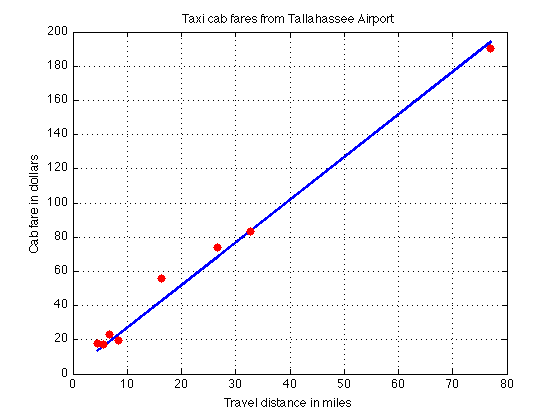
tally_cab records the distance in miles (from Google Maps) and a taxi cab fare in dollars, from the Tallahassee Airport to various destinations, including Saint George Island.
titanium_data is a dataset from Carl DeBoor's "A Practical Guide to Splines". 49 pairs of (x,y) values are recorded, which represent the variation of some property of titanium.
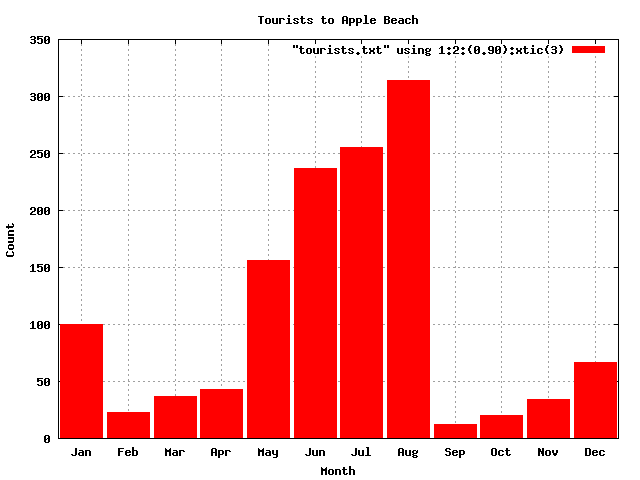
tourists contains the number of tourists to Apple beach each month. The file contains 12 records, with each record listing the index (1-12) of the month, the number of tourists, and a 3 letter month abbreviation.
turtles contains measurements for 54 turtles, taken from two collections: SREL (Savannah River Ecology Lab) and CMNH (Carnegie Museum of Natural History). The sex of the turtle is described as "M" or "F", the length and width of the carapace are given, followed by the 'height', defined as the measurement of the carapace plus the plastron.
volcano_data is based on a rectangular grid of 87 X coordinates and 61 Y coordinates. At each grid point (X(I),Y(J)), the value Z(I,J) stores the height of a volcano. There are 87 records in the file, one for each X value. Each record contains 61 values of Z, one for each Y value.
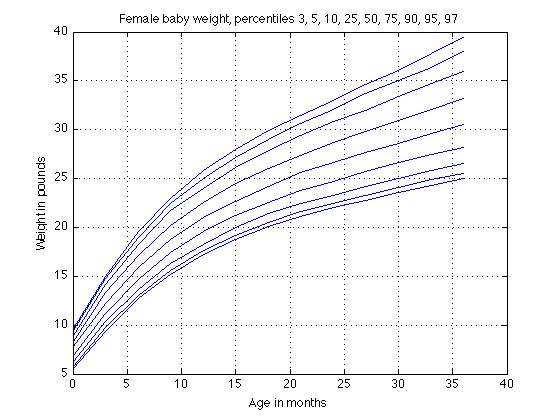
weight_female_baby records the weight in pounds of female babies, measured every three months from 0 to 36 months, for the 3rd, 5th, 10th, 25th, 50th, 75th, 90th, 95th and 97th percentiles, taken from the 2000 CDC Growth Charts.
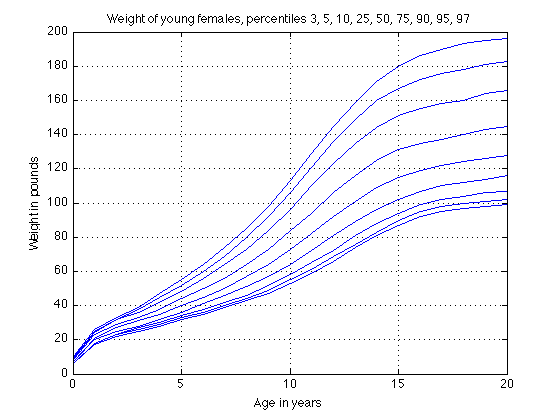
weight_female_young records the weight in pounds of young females, measured every year from 0 to 20 years, for the 3rd, 5th, 10th, 25th, 50th, 75th, 90th, 95th and 97th percentiles, taken from the 2000 CDC Growth Charts.
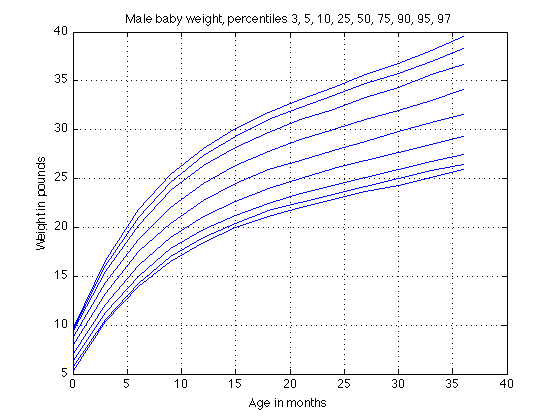
weight_male_baby records the weight in pounds of male babies, measured every three months from 0 to 36 months, for the 3rd, 5th, 10th, 25th, 50th, 75th, 90th, 95th and 97th percentiles, taken from the 2000 CDC Growth Charts.
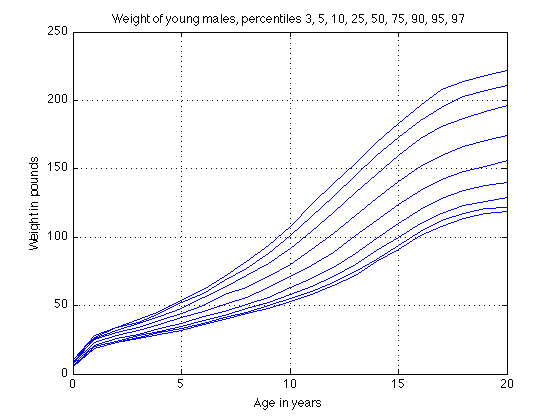
weight_male_young records the weight in pounds of young males, measured every year from 0 to 20 years, for the 3rd, 5th, 10th, 25th, 50th, 75th, 90th, 95th and 97th percentiles, taken from the 2000 CDC Growth Charts.